2.1
According to the WHO,[4] “air pollution is one of the biggest environmental threats to human health, alongside climate change”. In 2018, Health Protection Scotland published an assessment which estimated 1,724 deaths of adults over 25 years of age in Scotland were attributable to PM2.5 in 2016.[5] This estimate has largely reduced in line with the trend of slowly reducing PM concentrations in recent years. The health impact is exacerbated in the old, the young and people with pre-existing conditions.[6]
2.2
As well as the human health impacts, air pollution can damage the environment including Scotland’s sensitive habitats (for example, peatlands) by contributing to the acidification of rain, changing nutrient balances which can cause ecosystem imbalances, altering soil pH,[7] as well as generally changing the reflectivity of the atmosphere and the earth’s surfaces.[8],[9],[10] However, given the variability in PM deposition, its chemical composition and differential impact on different receptors, predicting the impact of PM on these sensitive habitats is challenging and subject to uncertainty. This analysis focuses on human health impacts from PM.
2.3
PM is one form of air pollution that can impact air quality. It describes a very small collection of matter, either solid or liquid. Fine PM, or PM2.5, (those with diameter up to 2.5 micrometres (µm[11])) are particularly damaging to human health because they more easily penetrate into the lungs and circulatory system, so there is now considered no safe level of PM.[4],[12],[13] PM10 describes those up to 10 µm in diameter. Other size fractions of PM are now recognised as important (for example PM1 and PM0.1) but are not currently widely monitored and the evidence base is more limited. The analysis has therefore been limited to PM2.5 and PM10.
2.4
There are a range of metrics used to measure air pollution from PM:
- concentration – the amount of a pollutant in a given volume of air measured directly or indirectly. Concentrations are specific to the air sample being measured at a particular place and over a particular time period (and therefore have their limitations). The quality of the air people breathe is usually reported as a concentration with respect to a particular pollutant of interest within it
- emissions – may refer to actual direct emissions or a modelled estimate, usually based on measurements and assumptions of the rate of release of a gas into the atmosphere. Emissions do not represent the air people will breathe, but policymakers have more control over them than concentrations, so they are also an important metric
- population-weighted mean concentrations – annual mean concentrations are estimated for every square kilometre (km) of the UK using the Pollution Climate Mapping (PCM) model. The population-weighted mean concentration is used as a measure of the impact of PM2.5 on the health of the total population by applying a weighting factor proportionate to population density within the same square km
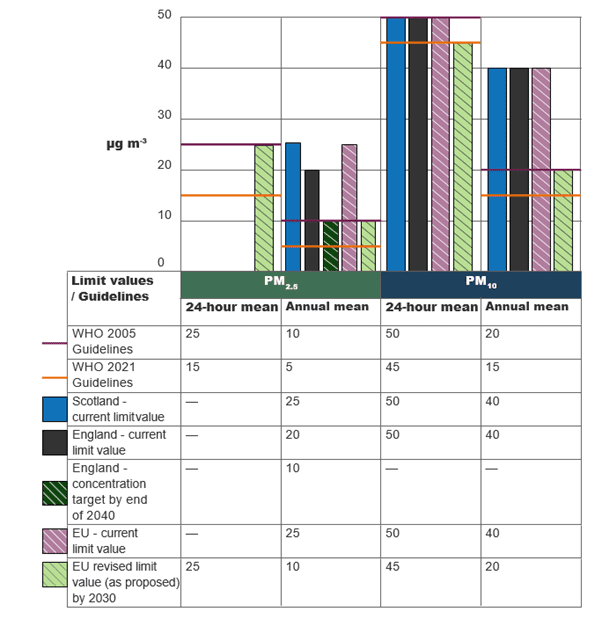
- limit values – target concentrations of a pollutant to be achieved by specified dates. These generally originate from EU legislation and are transposed into domestic law. They exist either without exception or with a permitted number of exceedances in a year
- objectives – target concentrations of a pollutant to be achieved by specified dates and usually represent a compromise position on limit values set for human or environmental health purposes
2.5
Understanding how air quality impacts human health at a societal scale requires understanding of population dynamics, such as: age; any underlying health conditions that may be exacerbated by poor air quality; and where people with these characteristics are spending their time.
2.6
PM may be emitted, or released, as a primary pollutant already in its PM form (e.g. as carbon from combustion or dust from industrial abrasion). Alternatively, it may be created in the atmosphere as a secondary pollutant from emissions of other primary pollutants (e.g. ammonia from agriculture and sulphates from shipping). These secondary processes can be particularly driven by transport from other places, meteorology and natural emissions.[26] Secondary inorganic aerosol (SIA) (aerosol not containing carbon) is a major contributor to PM10 and PM2.5 in the UK, estimated at approximately 40% of total PM2.5.[14] The contribution of ammonia as ammonium (NH4) within that SIA varies in time and space and is uncertain. The relationship between emissions and the formation of SIA is known to be complex and non-linear, meaning reductions in emissions of precursors will not necessarily translate directly to better ambient air quality.[15]
2.7
It is these complex processes that make present and future concentrations of PM difficult to predict in comparison to other pollutants, and all secondary contributions are not yet included in the National Atmospheric Emissions Inventory (NAEI).[16] This means the contribution of sectors such as agriculture is not fully captured in emissions data, and the science of source attribution is not yet mature enough to rectify this.
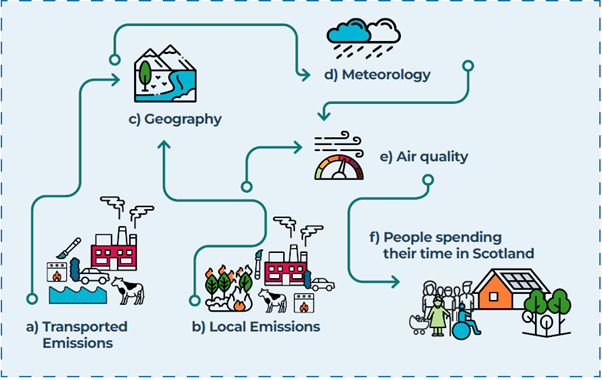
Figure 2 1– A schematic of the need to consider many factors when understanding how air quality impacts human health. How humans are impacted by air depends on their health or vulnerability, where they live and the quality of the air they are breathing over time. The quality of air (e) people will breathe, is a function of transported emissions (a), local emissions (b), geography (c), meteorology (d) and how air passes through these influences and undergoes chemical and physical transformation before it reaches people’s lungs (f).
2.8
The UK’s (and within it Scotland’s) air quality benefits from its geography, meteorology and a low population density compared to many other countries, especially its European neighbours.[17],[18],[19]
2.9
The prevailing wind direction in Scotland is from the Atlantic, relatively free of its own emissions sources (“a” in Figure 2‑1 tends to be over long distances) and there is generally meteorology (“d” in Figure 2‑1) favourable to washing out pollutants from the atmosphere (though this can have effects on land and water).
2.10
As a result, the UK is responsible for a higher proportion of its average experienced concentrations of PM than many other countries (40% for PM2.5).[20] This data is not available at a Scotland level but given the marine-dominant local geography and prevailing wind patterns of Scotland, it is expected that these aspects will be further amplified for Scotland compared to the UK. Notwithstanding specific pollution events beyond domestic control (such as a volcanic eruption or combustion event having transboundary impact), the UK’s and Scotland’s policymakers generally have greater control of their own air quality than most other European countries.[21] This is due to relatively clean incoming air, and other factors influencing the emissions/concentration relationship, which are relatively favourable.
2.11
This has, along with some effective policy measures, enabled Scotland, as part of the UK, to set lower concentration objectives (under the Air Quality (Scotland) Regulations 2000) that are more stringent than the associated limit values (set under the Air Quality Standards (Scotland) Regulations 2010) to date, and to achieve better air quality with respect to PM, than many comparator countries. For example, in the WHO’s most recent (2023) ambient air quality database, Scottish locations are amongst the lowest 10% on PM concentrations across sites in the WHO European zone, although comparisons need to be treated with caution.[22] Exceedance of the WHO’s Air Quality Guidelines (AQGs) and comparison with Europe is covered in section 5.
2.12
On a concentration basis, in 2021 (the most recent year for which validated statistics are available) all zones and agglomerations (as designated for reporting requirements under the Air Quality Standards (Scotland) Regulations 2010) in Scotland met the existing EU-transposed limit value for annual mean concentration of PM2.5 and PM10.
[4] New WHO Global Air Quality Guidelines aim to save millions of lives from air pollution, 22 September 2021.
[5] Air pollution and health briefing note: mortality associated with exposure to fine particulate matter (PM2.5 attributable mortality) in Scotland – Publications – Public Health Scotland, 18 June 2018; Accessed 2 November 2023.
[6] Frequently Asked Questions – Personal interventions and risks – Air Pollution – WHO Accessed 12 December 2023.
[7] Ecological effects of particulate matter – ScienceDirect
[8] Rowe EC, Sawicka K, Tomlinson S, Levy P, Banin LF, Martín Hernandez C & Fitch A (2021) Trends Report 2021: Trends in critical load and critical level exceedances in the UK. Report to Defra under Contract AQ0849, UKCEH project 07617.
[9] Air pollution, ecosystems and biodiversity, UNECE, Accessed 1 Feb 2023,
[10] Visibility and Regional Haze | US EPA, Accessed 31 August 2023.
[11] 1000 µm is 1 millimetre
[12] Policy paper September 2021: Air quality factsheet.
[13] COMEAP statement: response to publication of the World Health Organization Air quality guidelines 2021 – GOV.UK (www.gov.uk), 2022, Accessed 31 August 2023.
[14]Air Quality Expert Group, Fine Particulate Matter (PM2.5) in the United Kingdom 1212141150_AQEG_Fine_Particulate_Matter_in_the_UK.pdf (defra.gov.uk)
[15] Modelling PM2.5 workshop_summary 15_03_21 (defra.gov.uk)
[16] NAEI, UK National Atmospheric Emissions Inventory – NAEI, UK (beis.gov.uk)
[17] Population density (people per sq. km of land area) – European Union | Data (worldbank.org)
[18] Scotland’s Census 2022 – Rounded population estimates | Scotland’s Census (scotlandscensus.gov.uk)
[19] Figure 5.25, Health risks of particulate matter from long-range transboundary air pollution, 2006, WHO. https://www.who.int/publications-detail-redirect/E88189
[20] Table 5.4, Health risks of particulate matter from long-range transboundary air pollution, 2006, WHO.
[21] As part of the UK. Figures 5.24 and 5.25, Health risks of particulate matter from long-range transboundary air pollution (who.int)
[22] Data for Across all GBR sites, the 5 Scottish sites (Inverclyde, Aberdeen, Glasgow, Edinburgh and Highland) with measurements have the 5 lowest annual mean concentrations in 2020. Across all European sites, all Scottish sites are within the lowest 5% of records and lowest 10% by concentration for both PM10 and PM2.5. WHO Ambient Air Quality Database
[26] Particulate Matter in the United Kingdom, AQEG, 2005. Accessed 16 August 2023.