• 29 October 2024

Glossary

ALDFG – Abandoned, lost and discarded fishing gear

CAR – Water Environment (Controlled Activities) (Scotland) Regulations 2011

CPs – Contracting Parties

DRS – Deposit Return Scheme

GBR – General Binding Rule

INNS – Invasive non-native species

MCS – Marine Conservation Society

MSFD – Marine Strategy Framework Directive

NGOs – Non-governmental organisations

NMP –  National Marine Plan

OMRs – Offshore Marine Regions

OSPAR – Convention for the Protection of the Marine Environment of the North-East Atlantic

POPs – Persistent Organic Pollutants

PPC – Pollution Prevention and Control (Scotland) Regulations 2012

SBLPI – Scottish Beach Litter Performance Indicators

SBSDP – Scottish Biodiversity Strategy Delivery Plan

SMA2020 – Scottish Marine Assessment 2020

SMRs – Scottish Marine Regions

SUDS – Sustainable urban drainage system

UKMS – UK Marine Strategy

WEWS – Water Environment and Water Services Act 2003

WWTW – Waste Water Treatment Works


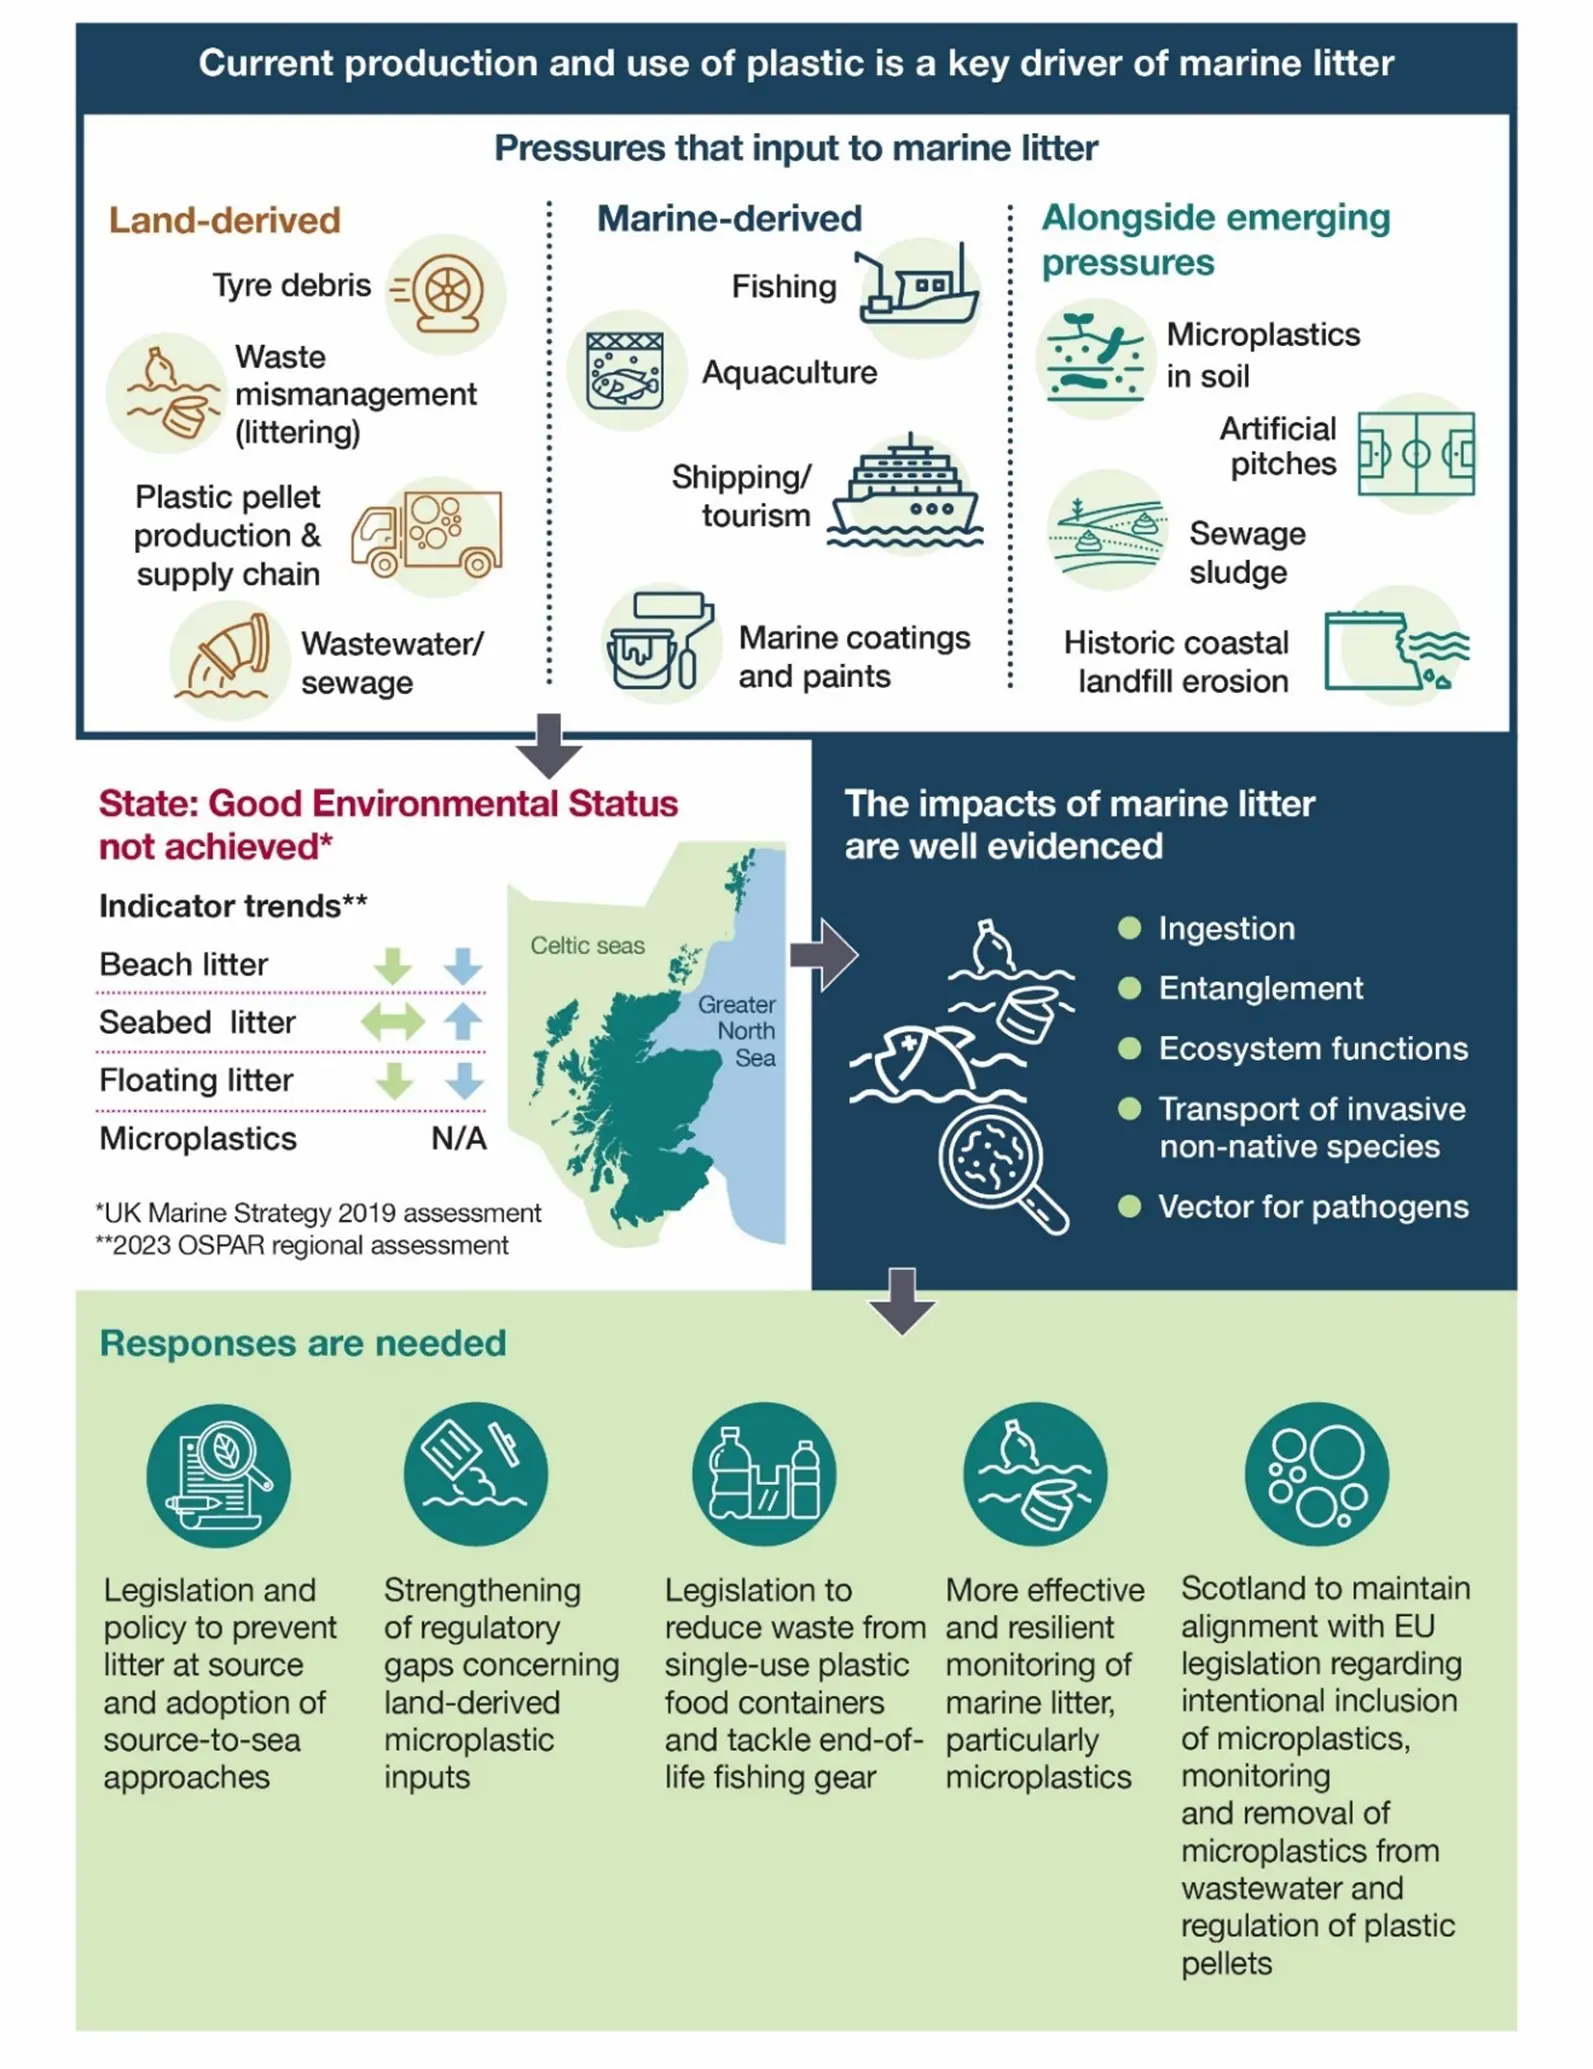
Infographic showing the pressures that input to marine litter, the 'Good Environmental Status' not being achieved, impacts of marine litter and the responses that are needed.
  • 29 October 2024

Key findings and recommendations

Marine litter is any solid material which has been deliberately discarded or unintentionally lost on beaches, on shores or at sea. It includes materials transported from the land by rivers, drainage or sewage systems or wind. Marine litter is dominated by plastic. Across the North-East Atlantic, plastic items represented 94% of litter items found on beaches. The most recent assessment of UK beach litter indicates that between 2020 and 2022 Scottish beaches had the highest recorded median level of beach litter with 919 items per 100 metres.

Marine litter affects many marine organisms. Two of the most evidenced impacts are ingestion and entanglement of marine species in marine litter with over 40,000 cases now cited within the scientific literature. The ingestion of plastic litter is a key threat to many seabirds with one study reporting up to 74% of seabird species studied having ingested plastics across the North-East Atlantic.

Microplastics have been shown to affect protected species across Scotland’s marine environment. In Orkney, microplastics adhere to seagrass beds, with over 80% of marine biota collected from the seagrass beds containing microplastics. Around 11% of surveyed organisms in a Special Area of Conservation in the Outer Hebrides had ingested microplastics.

While less understood, marine litter has been linked to ecosystem-level impacts, such as changes to species’ growth and feeding rates, including growth rates and tissue health of cold-water corals in Scotland. However, extrapolating such impacts to changes in ecosystem functioning remains challenging due to the inability to measure and model such processes on a global scale (see section 3.1 to 3.8).

Alongside this, several emerging threats have been associated with marine litter including: the leaching of pollutants during plastic degradation; the adsorption (adhesion) of pollutants to the surface of plastic and its role as a vector for invasive non-native species in the UK (see section 3.9 to 3.23).

Scottish Ministers have obligations under both Scottish and UK-wide legislation to address marine litter across Scotland’s marine environment. For example, as part of the UK, Scotland has committed to contributing to the achievement of Good Environmental Status (GES) for marine litter by 2020 under the ‘UK Marine Strategy’ (UKMS). The UK is also a Contracting Party to the ‘Convention for the Protection of the Marine Environment of the North-East Atlantic’ (OSPAR) – the regulatory instrument that coordinates regional co-operation across the North-East Atlantic for its protection (see section 7.1 to 7.9).

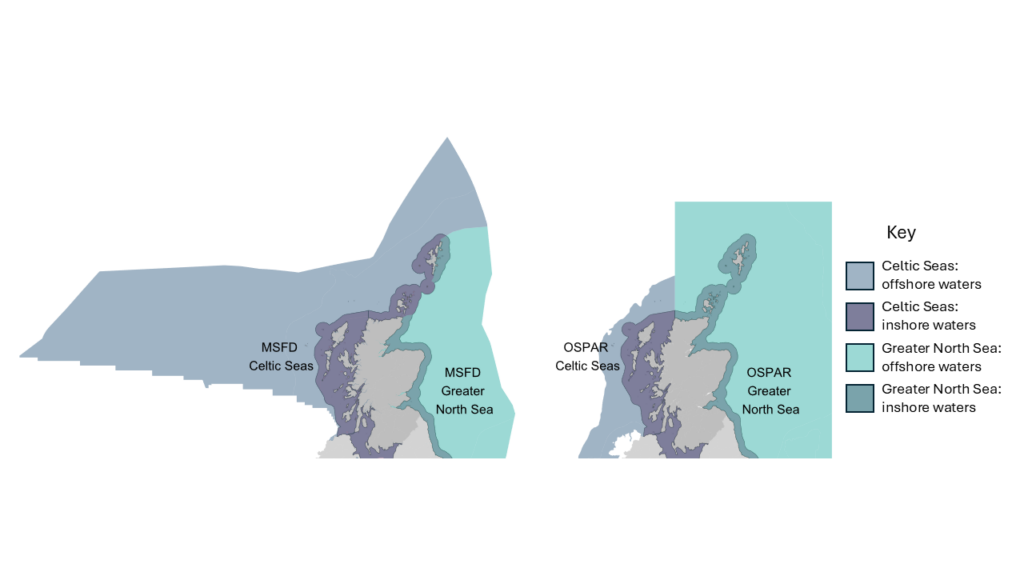
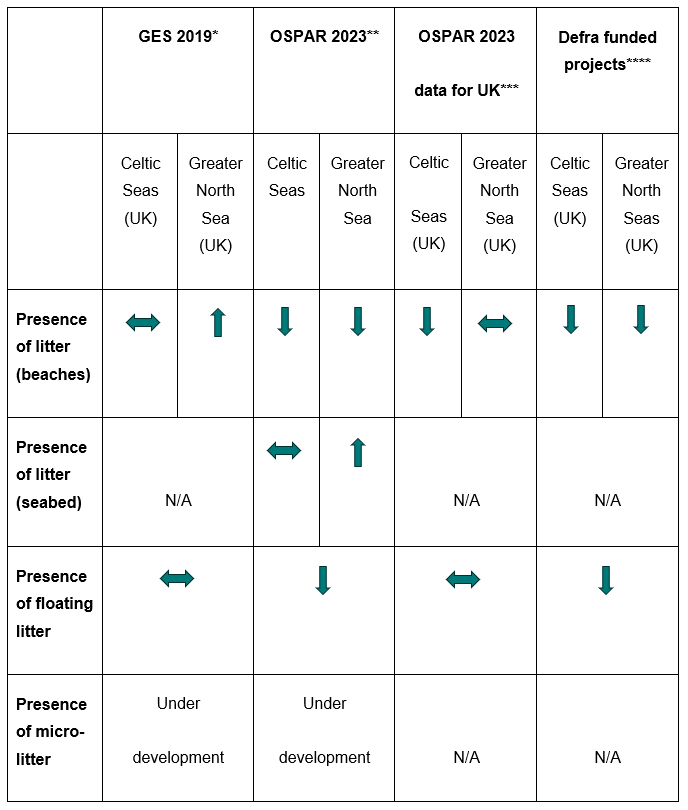
Key finding 1: The most recent assessment (2019) indicates that the UK is currently failing to reach GES for marine litter. While improvements have been reported from more recent data, the abundances of beach and floating litter across the UK in areas surveyed under the UKMS is still far exceeding OSPAR threshold value levels set to reduce harm from beach and floating litter.


Land-derived litter in the marine environment

The current monitoring programmes for marine litter (such as the UKMS and OSPAR), along with evidence from the wider scientific literature, suggests that land-derived sources are a greater contributor to marine litter than marine-derived sources. In Scotland, particularly prevalent sources are the mismanagement of waste and sewage-related debris. Land-derived plastic litter can be directly discarded into the ocean and coastal environments or transported to the sea via inland waterways, rainwater runoff, wind and wastewater outflows. More than 60% of marine plastics on Scottish coasts are attributed to littering by the public which then enters the marine environment through rivers (see section 2.9 to 2.26).

Several emerging sources of marine litter (including in Scottish waters) have also been identified, the impacts of which are not yet well understood. These include marine litter derived from microplastics in soil, landfill erosion, the use of sewage sludge and artificial turf infill (see section 6.1 to 6.12).

Key Finding 2: Given that marine litter can enter Scotland’s marine environment from a range of land-derived activities, such as waste, agriculture and wastewater. The current legislative and regulatory framework relevant to land-derived litter is not aimed at protecting the marine environment. For example, regulations controlling surface water run-off, sewage discharges (both treated and untreated), landfilling of waste and industrial activities aim to limit the release or effect(s) of contaminants that constitute litter, but currently have minimal regard for their impact on the marine environment. This limits the ability to quantify such sources and assess their potential effect(s) on the marine environment.

Environmental Standards Scotland (ESS) finds that there needs to be greater coherence and coordination across the current legislative and policy frameworks to control land-derived sources of marine litter. This would increase opportunities to prevent litter prior to it reaching the marine environment, such as microplastic release in wastewater effluent. For example, greater integration between the Scottish Government’s ‘Marine Litter Strategy’ and the ‘National Litter and Flytipping Strategy’ should lead to stronger measures to reduce land-derived litter at source.

Recommendation 1: The Scottish Government should establish a ‘source-to-sea’ approach to enhance the effectiveness of current and future policy and legislation by improving coordination between terrestrial and marine litter strategies.

Microplastics are present in all surface waters surveyed in Scotland and within marine sediments. Across the European Union (EU) and OSPAR region, the most significant sources of land-derived microplastics are particles in road runoff released from tyre abrasion, microplastics from treated sewage effluent and plastic pellet loss. Current statutory monitoring does not allow an understanding of these sources at a Scotland or UK-level and very few studies exist within the scientific literature (see section 2.26 to 2.41).

Key finding 3: ESS has identified several potential gaps and inefficiencies regarding current measures used under regulatory frameworks governing surface water run-off from roads, the discharge of treated sewage, and plastic production and the pre-production pellet supply chain in limiting microplastics from entering the marine environment. Pellet loss was acknowledged in the draft ‘Scottish Biodiversity Strategy Delivery Plan’ (SBSDP) and indicates that measures to improve plastic pellet handling and management across the plastics supply chain will be introduced by the end of 2025 (see section 4.1 to 4.22).

Recommendation 2: The Scottish Government should specify how they plan to implement improvements to the handling and management of plastic pellets and clarify if they are on target to implement this by the end of 2025.

Key finding 4: Despite the introduction of targeted legislation to reduce plastic waste in Scotland, single-use plastic items continue to dominate marine litter. At the EU-level, the Zero Pollution Action Plan aims to reduce plastic pollution at sea by 30% by 2030. A key component of this plan is the adoption of a circular economy approach to plastic through the ‘European Strategy for Plastics in a Circular Economy’ (see section 4.27 to 4.28).

Recommendation 3: The Scottish Government, working with the UK Government where appropriate, should bring forward legislative proposals to reduce waste from single-use plastic food containers and plastic bottles and adopt a more circular economy approach to reduce plastic production.


Marine-derived litter in the marine environment

Despite strong international and domestic legislative frameworks aimed at preventing the generation of marine-derived litter, fishing-related litter is the most detected type in Scotland and can be a key contributor to marine litter across the Highland and Islands coasts (see section 2.17 to 2.18).

Key finding 5: Multiple factors affect the Scottish Government’s ability to reduce fishing-derived litter. These include a lack of understanding of the causes of fishing-derived marine litter in Scotland and a lack of regular data collection on the fishing gear in use by Scottish vessels and fishing waste generated in Scotland. This information is key to informing the most appropriate mitigation measures (see section 2.43 to 2.56).

Improvements are also needed to how end-of-life fishing gear is managed as a waste, considering the potential for reuse, recycling of elements and appropriate waste management and recycling facilities at port. This is partly acknowledged by the Scottish Government’s draft SBSDP action to deliver improved waste management for end-of-life fishing gear by 2027. At EU-level, in 2021 the Single-Use Plastics Directive introduced a requirement for an extended producer responsibility scheme for fishing gear containing plastic to reduce its impact on the marine environment. This has not yet been replicated in UK law (see section 5.5 to 5.8).

Recommendation 4: The Scottish Government should work with the UK Government to bring forward measures to tackle end-of-life fishing gear and should establish a programme of work to identify and address the drivers and causes of fishing-derived marine litter in Scotland.


Monitoring of marine litter

Key finding 6: There are several limitations to the current monitoring programmes for assessing marine litter under the UKMS. These need to be addressed to better understand trends in, and be representative of, marine litter at a Scotland-level or waters relevant to Scotland. A key part of this is the indicator for beach litter that is used to assess if GES has been achieved. For the most recent GES assessment (and upcoming assessment), data from just three Scottish beaches (all located around the Firth of Forth and Firth of Clyde) was included and is therefore unlikely to be representative of beach litter around the whole of Scotland.

At a UK-level, current indicators for marine litter under the UKMS provide an assessment of where litter is deposited/likely to ‘end’ up at a singular time point within the marine environment. As a result, current indicators do not enable effective monitoring of the flux of marine litter or adequate identification and monitoring of the key sources and pathways of marine litter, such as the input of litter to the marine environment via rivers. Current indicators need to be strengthened so that data collected is representative of Scottish beaches and effectively monitors the sources, pathways and fluxes of marine litter (see section 9.1 to 9.12).

The next assessment of GES (due in 2024) will not include the anticipated common OSPAR indicator for assessing microplastic in marine sediment, despite being an operational target in the ‘UK Marine Strategy Part 2’ report, as it has not been formally accepted for use at a UK-level yet. As a result, there is currently no statutory monitoring of microplastics in the marine environment in Scotland.

Citizen science performs a fundamental role in understanding marine litter. Data collected through citizen science initiatives provides the greatest contribution to understanding the extent and potential sources of beach litter across Scotland’s marine environment. This data also underpins Scotland’s, and the wider UK’s, statutory monitoring obligations of beach litter under the UKMS and OSPAR.

Current statutory monitoring obligations under the UKMS do not provide a comprehensive assessment of marine litter at a Scottish scale. Data gaps are currently being partially filled by non-governmental organisations’ (NGOs) citizen science initiatives. Given this, statutory monitoring to better understand the current extent and the most prevalent and emerging sources of marine litter at a Scotland-level must be strengthened. This monitoring should be underpinned by a statutory framework to ensure that monitoring of marine litter is effective and resilient, whether delegated to public authorities or NGOs where appropriate (see section 9.13 to 9.17).

Recommendation 5: The Scottish Government should work through OSPAR and with the UK Government to agree a programme to implement suitable indicators and an effective and resilient monitoring programme to assess marine litter.


Maintaining Alignment with Europe

Key finding 7: The Scottish Government will need to bring forward legislative proposals if Scotland is to maintain alignment with wider advancements in a number of areas of environmental standards and protection within the EU that have the potential to reduce the prevalence of land-derived inputs to marine litter (see section 10.1 to 10.10).

Recommendation 6: The Scottish Government should set out how it proposes to maintain alignment with regulatory developments in the EU that are aimed at reducing microplastics in the marine environment. Relevant developments include:

  • recently adopted measures to restrict the intentional inclusion of microplastics (covering all synthetic polymer particles below 5 mm that are organic, insoluble and resist degradation) into products under the Registration, Evaluation, Authorisation and Restriction of Chemicals (‘the REACH Regulations’)
  • a recast Urban Waste Water Directive that will introduce requirements to monitor microplastics in wastewater inlets/outlets and undertake treatment of wastewater to remove microplastics
  • a proposal to introduce the first regulatory measures to directly tackle pollution from the unintentional release of plastic pellets across the pellet supply chain
  • a recently adopted regulation that sets requirements for manufacturers to measure tyre abrasion and for the EU Commission to define abrasion limits for tyres


  • 29 October 2024

1. About this report

1.1

ESS’ strategic plan identified a number of analytical priorities.[1] One of these is “developing a better understanding of threats to the marine environment”. Following a systematic scoping process and evaluation of different marine topics, marine litter was identified as a priority analytical topic under this strand of work. Marine litter was highlighted as an issue of concern by key stakeholders and was reflected in OSPAR reporting and the Scottish Marine Assessment 2020 (SMA2020) with Scottish sources and source control identified as potential priorities for further analysis.

1.2

Section 20 of the ‘UK Withdrawal from the European Union (Continuity) (Scotland) Act 2021’ (‘the 2021 Act’) defines ESS’ functions. ESS’ remit is to:

  • ensure public authorities, including the Scottish Government, public bodies and local authorities, comply with environmental law
  • monitor and take action to improve the effectiveness of environmental law and its implementation

1.3

The analysis presented here focuses on the effectiveness of the relevant legislation governing land- and marine-derived in Scotland and the UK given that the UK (including Scotland) is failing to meet GES. As part of this, this report analyses data underpinning the UK’s statutory assessment of GES for marine litter descriptors under the UK Marine Strategy Regulations 2010.

1.4

In addition to defining ESS’ functions, section 20 of the 2021 Act enables ESS to make recommendations to public bodies. ESS can also identify specific concerns that merit further investigation by it, or topics that will be prioritised for future analysis or ongoing monitoring.

1.5

Understanding the extent, composition and abundance of marine litter is complex. The movement of marine litter is not limited by geographical boundaries and is influenced by both marine and land-based activities. As a result, several drivers are underpinning both land- and marine-derived litter that are accompanied by a complex legislative and policy landscape, at a Scotland, UK and international level.

1.6

This report:

  • summarises the current evidence from a review of published documents regarding the composition and distribution of the key marine litter sources in Scotland, taking in wider evidence where appropriate
  • summarises a literature review into the known ecological impacts of marine litter
  • examines the effectiveness of existing legislation and policy relevant to land- and marine-derived litter, including in light of revisions targeting plastic litter;
  • summarises a literature review into the emerging sources of marine litter and emerging ecological impacts
  • analyses available data associated with the marine litter descriptors under the UKMS and OSPAR

1.7

ESS’ findings and recommendations are based on its analysis of available data and published documents, and discussions with the Scottish Government.

1.8

ESS asks the Scottish Government to respond to the recommendations in this report as soon as possible, and within six months of publication. Nothing in this report, or the recommendations made within it, prejudices ESS’ ability to make decisions about further scrutiny of the topics covered, for example, in response to representations made to ESS on related matters.


[1] Environmental Standards Scotland, Strategic Plan 2022-25. (2022) ESS Strategic Plan 2022-25 – Environmental Standards Scotland.

  • 29 October 2024

2. The drivers, pathways and prevalent sources of marine litter across Scotland and globally

2.1

This section explores what is currently known regarding the drivers of marine litter in Scotland. This includes the current understanding of the key sources and pathways from which litter enters the marine environment, referring to evidence from the wider UK and globally where needed. The pressures of such sources on the distribution and composition of marine litter across Scotland’s marine environment are then discussed.


Drivers of marine litter

2.2

Plastic is now the most prolific form of litter detected across marine environments globally and can form up to 95% of litter found on beaches, the sea surface and the seafloor.[2] Across the North-East Atlantic, plastic items represented 94% of litter found on beaches in the latest ‘OSPAR Quality Status Report 2023’ at the OSPAR Maritime Area Scale.[3]

2.3

Plastic litter is primarily classified by size and is categorised into macroplastics and microplastics, the latter of which is broken down into primary and secondary microplastics – these are defined in Table 1. Nanoplastics, plastic particles less than 1000 nm in size, have only recently been a focus of scientific research and data surrounding the impacts of nanoparticles is not conclusive.[4] Given this, potential sources of nanoplastics have not been considered here.


Table 1. Classifications of plastic litter in the marine environment

Type Definition
Microplastics

(<5 mm in size)

Primary microplastics: intentionally manufactured plastic particles, e.g. virgin plastic pellets or ‘nurdles’, microbeads in personal care products.


Secondary microplastics: formed from the fragmentation of macroplastics through weathering (abrasion, degradation with UV light) or through product use, such as fibres from textiles and plastic particles from marine paints, tyre and brake debris.[4],[5]

Macroplastics

(> 5 mm in size)

Larger plastic items, largely visible to the human eye, such as plastic packaging (e.g. bottles, caps, bags), fishing nets, shipping debris and sewage-related debris (e.g. sanitary products and wet wipes).


2.4

The proliferation of plastic within the marine environment is linked to the rapid increase in the production and utilisation of plastic over the last half a century, with global production increasing from ~5 million tonnes (MT) in 1950 to 30 MT in 1988 and was reported to be 390.7 MT in 2021.[6],[4] The utilisation of plastic across many sectors (e.g., healthcare, agriculture, textiles, fishing and aquaculture) has been driven by its inherent properties of being lightweight, cheap to produce, durable, corrosion and flame-resistant, and versatile.5 For Europe, over 57.2 MT of plastic was produced in 2021 with packaging forming the largest end-use market for plastic, comprising 39.1% of plastic products. More than 87% of plastics produced in Europe were formed from fossil-based plastic as opposed to recycled or bio-based plastics.[6]

2.5

These same properties facilitate the longevity and dispersal of macro and- microplastics litter once in the marine environment and further degradation of macroplastics to secondary microplastics. Plastic items have now been reported across the most remote marine environments, with forms of plastic pollution being detected in the surface waters of the Antarctic Peninsula,[7] Arctic[8] and ingested by deep-sea organisms.[9]

2.6

Empirical estimates of the abundance, trends and fate of marine litter are lacking. This is due to many complex factors affecting the distribution of marine litter (discussed below); a lack of quantitative data, particularly for regions less accessible such as the high seas and deep seas, and a lack of standardised methods used to report on marine litter.[10] Evidence suggests that the seafloor acts as the largest sink for litter entering the marine environment,[11],[12],[2] with as much as 94% of all plastic litter residing on the seafloor, equating to 25.3 to 65 million tonnes.[13],[11] For the North Sea, marine litter is abundant across the seafloor and up to 80% comprises plastic litter.[14]

2.7

Based on the global production and mismanagement of plastic waste, “business as usual” scenarios estimate that between 10.5 and 28 million metric tonnes (MMT) of plastic litter could enter the marine environment by 2025, up from 4.8-12.7 MMT estimated in 2010.[15]


Pathways and sources of marine litter

2.8

When considering the pathways in which litter enters the marine environment, it is generally classified as coming from either land- or marine-derived (or commonly referred to as land or marine-based) litter depending on where it entered the sea.[16] For this report, land-derived litter explicitly refers to the input of litter items that entered the marine environment from activities or sources on land. Marine-derived litter refers to marine litter items that originated from activities at sea.

2.9

It is widely report that as much as 80% of all marine litter is land-derived;[5],[17] however, very few quantitative estimates exist within the scientific literature for determining the exact contribution of land- and marine-derived litter.[17] This is partly due to difficulties in attributing litter items to the activity of origin following degradation, alongside the high spatial variability in the abundance and composition of marine litter (as discussed below). Current figures suggest that the prevalence of land- and marine-derived litter is dependent on the sea region assessed and analytical methodology used. Estimates for land-derived inputs across Europe range from 50%-84%, while at-sea sources can contribute 16%-50%.[18]

2.10

Land-derived plastic litter can be directly discarded into the ocean and coastal environments or transported to the marine environment via inland waterways, rainwater runoff, wind and wastewater outflows.[19],[16] Evidence suggests that the effects of climate change and increasing extreme weather events, such as increased rainfall, flooding[20] and stronger winds[21] have an influence on the deposition, abundance and movement of plastic waste across riverine/oceanic boundaries.

2.11

One of the most cited studies quantifying land-derived marine litter estimated that 4.8 to 12.7 MT of macroplastic is derived from mismanaged waste (littered or inadequately disposed waste)[i] produced by coastal populations (defined as within 50 km distance of a coastline).[16] This equated to between 15% and 40% of littered waste entering the sea. For in-land pathways, it is estimated that 75,000 to 1.1 MT of plastic waste can enter via rivers annually; however, this is likely to vary depending on the catchment characteristics and flow rate of a river.[33]

2.12

Based on these estimates of ‘marine leakage’, a more recent study quantified the input of macro- and microplastics into the Scottish Atlantic Coast and North Sea Coast using simple oceanographic patterns. Estimates suggests that more than 60% of marine plastics, in some cases more than 90%, was attributed to littering by the public and was entering the marine environment through rivers.[22] This equates to ~1000 tonnes (T) of macro plastic each year.

2.13

Across the OSPAR Maritime Area, single-use plastics (e.g. plastic bags, cigarette filters, cotton bud and balloons) represented 26% of litter observed with an abundance of 45 items/100 m – greater than maritime-related plastic items (21%). For regions relevant to the UK, the Greater North Sea and the Celtic Seas single-use plastic items represented 37 items/100 m in each area.[23]

2.14

In Scotland, to better understand the movement of litter from land to sea via rivers, Keep Scotland Beautiful’s ‘Upstream Battle’ citizen science programme has surveyed sites along the River Tay and the River Clyde and their tributaries to assess common litter items that may be contributing to marine litter. Not surprisingly, highest recorded items comprised plastic (34.5% of items for the Tay and 41.7% for the Clyde) with top littered items including cigarettes, snack packets and plastic pieces.[24],[25]

2.15

The Marine Conservation Society (MCS) in 2009 reported that 37.5% of marine litter in Scotland originated from the public, whilst litter originating from fly-tipped waste comprised 1.6%.[26],[27] The current contribution of fly-tipped waste to marine litter is largely unknown. Based on the most recently reported estimate, using data collected in 2012, Zero Waste Scotland estimated that at least 26,000 T of waste is illegally flytipped each year.[28] More recent estimates and trends regarding flytipping have not been confidently assessed due to changes in reporting systems in Scotland. [29]

2.16

The contribution of the different sources of marine litter across Scotland’s coastal environment are highly variable and can be influenced by several factors, including coast type, catchment area population size, coastal currents and wind exposure.[30] For example, up to 93% of plastic from land-derived sources on the west coast originated from the Clyde catchment area. For the east coast, approximately 46% of plastic entering the sea from land originated from the Forth catchment. Around 40 T (eight million pieces) of macroplastic litter enters Scottish seas annually from remote sources.[31]

2.17

Comparisons between mainland and island regions report that, by count, the greatest contributor to island litter was marine-derived litter (48%), in contrast to land-derived litter for the mainland (47%). Fishing nets were the biggest sub-source of litter by count, with 19% comprising of fishing nets (0-50 cm).[32] Similar studies also report a greater influence of fishing-derived litter across more remote beaches across the Scottish continental shelf than mainland beaches.[33],[34] For the Orkney Islands, across 35 survey sites 47% of beach macro-debris was attributed to the fishing sector, while less than 10% was attributed to leisure and tourism-related activities.[35]

2.18

The most commonly detected litter items on Scottish OSPAR beaches between 2020 and 2022 were land-derived and included sanitary items, plastic pieces (2.5-50 cm), packets, cotton bud sticks, caps/lids and cutlery/trays/straws (see section 8).[36] Similarly, the largest source of litter items reported in the latest GES assessment for beach litter (2008 to 2015) were land-derived across the Marine Strategy Framework sub-regions Greater North Sea and Celtic Seas. The most commonly found litter items were made of plastic, specifically polystyrene fragments, followed by food and drinks packaging, sewage-related debris (SRD); however, this was followed by smaller fishing-related litter.[37]

2.19

SRD results from the discharging of raw sewage and storm water, either directly into the ocean or via rivers waters. The most recent assessment of UK beach litter reported that SRD was a top ten litter item across Scottish beaches, whereas this is not the case for beaches in England, Wales and Northern Ireland, indicating that SRD is a particular issue for Scotland.[37] Outside of GES, SRD is also routinely recorded during beach clean surveys across Scotland.[33],[38],[39]


Microplastics

2.20

Globally, microplastics are increasingly being detected in the marine environment,[40],[41],[78] alongside the growing public awareness[42] of their prevalence and potential ecological impacts (see section 3). Despite this, the major sources of microplastics, composition and distribution in the marine environment remain understudied.[43] Estimates of microplastics in the ocean range from thousands to hundreds of thousands of particles per km2[44],[2] and can be readily transported from surface waters, where they first float, through the water column to the deep ocean, washed up on beaches and in sea ice.[2]

2.21

For Scotland, the only statutory monitoring and assessment of microplastics was delivered through the SMA2020, which surveyed microplastics in surface waters of Scotland’s Marine Regions (SMRs) and Offshore Marine Regions (OMRs)[ii] from 2013/14 to 2019/20 (see Figure 4).[45] Results showed that microplastics (defined as particles sized < 5 mm in their longest dimension) are present in the surface waters of all marine regions sampled. Microplastic concentrations ranged from 0 to 91,128 particles per km2 with hotspots in the Clyde SMR (0 to 77,168 particles per km2), particularly at the head of Loch Long Forth, and Tay (0 to 83,729 particles per km2) and the Solway (607 to 91,128 particles per km2).[46]

2.22

Fragmented plastics, microplastic particles or fibres formed from the breakdown of larger plastic items, accounted for almost 50% of the microplastics recovered in the SMA2020. The second most abundant form of plastic was microbeads originating from personal care products.[47]

2.23

The input of microplastics into the aquatic environment can be influenced by several factors, these include land-use (e.g. application of sludge[47] and proximity to waste water treatment plants)[48] proximity to urbanised regions[49] and marine activities, such as proximity to fishing grounds.[50],[51] However, evidence also suggests that factors such as population density[52], or geographic remoteness[53] are not always accurate predictors of microplastic abundance as plastic particles can be transported away from input sources via oceanic currents. This is likely the case for low microplastic abundance in the Solent estuary[54] and high microplastic abundance in intertidal sediments around Orkney[55] and in the Argyll SMR.[50]

2.24

Modelling of oceanographic currents with the microplastic estimates from the SMA2020 estimated that between 124 to 127 T of microplastics enter the Atlantic coast regions and North Sea coast annually, compared to 477 T and 582 T of macroplastics, respectively. As much as 77% to 98% of microplastics enter these coastal waters from land-derived sources.[23] Land-derived microplastics can enter the marine environment through less obvious routes, such as microplastics bypassing wastewater treatment plants, through storm drains and through the air.[56] Estimating microplastic flux from Scottish rivers based on catchment population size and microplastic abundances from 13 rivers worldwide suggests that riverine inputs to sea are 22% (by mass) of macroplastics.[32]


Most influential land-derived sources of microplastics

2.25

Using evidence of the potentially most prevalent sources of marine litter across the EU, ESS collated the current understanding of such sources at a Scottish level. The composition, inputs and major sources of marine litter across Scotland were also explored.


Surface water run off: tyre wear

2.26

A review for the EU Commission in 2018 examined the main sources of secondary microplastics (released through ‘wear and tear’ or accidental spills, not intentionally added microplastics e.g. microbeads) into the aquatic environment from EU28 Member States, Norway and Switzerland. Modelled pathways of microplastics into surface waters identified that particles released from tyre abrasion is the largest source of microplastics entering the aquatic environment, it is estimated that 503,586 T of microplastics per year are generated from the wear of automotive tyres.[57] An IUCN report that modelled releases of primary microplastics into the oceans, using empirical data on the consumption and use of tyre and loss through use, also identified tyre particles as the largest source of primary microplastics for Europe.[44]

2.27

A literature review of the quantifications of the major sources of marine microplastics within the OSPAR Maritime Area also indicates that tyre abrasion has the capacity to input the greatest amount of microplastics into the water environment; however, this was one of the most understudied sources within the scientific literature.[58]

2.28

Tyre tread particle emissions across seven European countries ranged from 0.52 to 1.5 kg per capita per year with the UK at 0.98 kg per capita per year.[59] However, no dedicated study has examined the pathway of tyre and road debris entering the aquatic environment or quantified this as a potential route for microplastics in marine litter in Scotland.


Treated waste water: microplastics

2.29

The same review for the EU Commission reported the second largest source of microplastics is from the washing of textiles due to the more clearly defined pathways from source to surface waters and waste water treatment works (WWTWs).[58] An OSPAR assessment also reported microbeads from personal care products emitted from treatment of domestic wastewater as the next most influential source of marine litter.[59]

2.30

For treated sewage, effluent released from WWTWs has been shown to be a potential route for microplastics entering freshwater environments, typically rivers, or directly into the marine environment.[60] WWTWs receive wastewater influent from domestic, industrial and surface water run-off. These can contain microplastics, such as microplastics intentionally added to cosmetics and industrial scrubbers, or secondary microfibres released from the washing of textiles.[57] WWTWs are primarily designed to remove biochemical oxygen demand, suspended solids and ammonia from wastewater, not microplastics.[61] Moreover, microplastic removal efficacy is dependent upon the treatment facility and the physiochemical properties of plastics, which affect their ability to be removed from wastewater.

2.31

Evidence indicates that primary and secondary treatment processing are largely effective at removing microplastics from treated wastewater with removal efficiencies of 95-99%[62],[63],[64] and ~100% removal performance for WWTWs activated sludge plants that have tertiary treatments.[65] However, evidence for the efficiency of microbead removal during tertiary treatment is less conclusive.[66] Despite this, it has been suggested that due to the large volumes of effluents being discharged from WWTWs, they are still a potentially significant source of microplastics into the aquatic environment.[67] For example, a secondary WWTW on the River Clyde, Glasgow, produces an average 260,954m3 of treated wastewater from a population of approximately 650,000 people. Despite a microplastic removal rate of 98.4%, based on three years of average daily flow rate data, it was estimated that over 65 million microplastic particles were still released in the final WWTW effluent every day.[49]

2.32

A study examining microplastics in the intertidal sediments across Scapa Flow, Orkney found microfibres were generally more abundant than plastic particles. As well as hydrographic conditions, the authors stated that high microfibre abundance at Congesquoy was highly likely to be linked to its proximity to the wastewater treatment plant at Bu Point, which according to Scottish Water discharges 750m3 into the Bay of Ireland daily.[56] Elsewhere in the UK, for the Solent estuary, the most commonly detected microplastics were from sewage and wastewater including fibres from textiles and rounded pellets most likely from cleaning and cosmetic products, alongside pre-production pellets that were also visible on the river bank.[55]

2.33

Microbeads from personal care products were the most detected primary microplastic across the SMRs surface waters sampled between 2014 and 2020. Despite a ban in Scotland in 2018 of microbeads being intentionally added to rinse-off cosmetic products, it is likely that these products remain in the environment from prior releases.[47]


Plastic pellet loss

2.34

The third largest source identified in the EU Commission review was plastic pellets, powders and flakes (hereafter referred to as pellets) although there is greater uncertainty surrounding the total amount entering the aquatic environment due to greater opportunities for capture prior to reaching a WWTW, alongside the variability in treatment processes/efficacies across WWTWs.[58] The OSPAR assessment also reports primary microplastics from industry (pre-production pellets) as #one of the largest sources of microplastic emissions across the OSPAR catchment area.[59]

2.35

Plastic pellets, commonly termed ‘nurdles’, are small 2-5 mm plastic particles used primarily within the polymeric plastic production industry.[68] Throughout the plastic production supply-chain, pellets can be lost due to spillages whenever they are handled, such as filling and emptying, storage, loading for transport and shipping. This is often referred to as ‘pellet loss’ and can lead to pellets being released into the environment, either through indirect or direct routes. Pellet loss can also occur from the mismanagement of plastic pellets, such as insufficient clean-up after a spill.[69]

2.36

An Impact Assessment accompanying an EU Commission provision to prevent plastic pellet loss estimated that between 52,140 and 184,290 T of pellets are unintentionally released into the EU environment annually. This comprises 0.08 to 0.28% of total pellets volumes in the EU. Logistics (transport, intermediate storage and handling during these operations) attributed the largest pellet loss (27,870 to 111,480 T), followed by converters (15,600 to 46,800 T), producers (7222 to 21,665 T) and recyclers (1448 to 4345 T).[70]

2.37

Very few studies have attempted to quantify pellet loss into the aquatic environment, despite being identified as a key source of marine pollution since the 1980’s.[71] Robust estimates come from the river Rhine, where spherules (pellets) comprised 60% of plastic particles within the river and were linked to different industries.[72] For the river Danube, during heavy rainfall researchers estimated 693 to 138,219 pellets per 1000 m3 within the Danube Alluvial Zone National Park that is adjacent to a plastic manufacturing site.[73]

2.38

To date there is no study that has directly measured pellet loss from UK industries. Eunomia conducted a study on behalf of Fidra to estimate total pellets lost from the UK plastics industry using estimates of pellet loss from two published reports, alongside an unsourced estimate from a UK processor. Based on this, Eunomia estimated that 48 to 480 T of pellets are lost at plastic processors annually each year in the UK, while 32 to 320 T are lost during transport and 25 to 250 T are lost at UK plastics producers.[74] This totals an estimated annual loss of 105 to 1,054 T pellets in the UK.

2.39

Eunomia estimated pellet loss throughout the supply chain for Scotland. This estimate assumed that 15%[iii] of the UK plastics industry is located in Scotland, alongside correspondence with an unnamed Scottish plastics producer, and estimates that 15.8 to 158.1 T of pellets could be lost annually from Scottish industries.[76] The Eunomia report acknowledges the limited number of studies available to estimate pellet loss in the UK but highlights their usefulness in helping to inform a true rate of loss.[75]

2.40

A study carried out in 2004 reported that plastic pellets were detected on the majority of beaches within the Firth of Forth but were not quantified as they were “too numerous to count”.[76] Polypropylene pellets were reported in the surface water assessment carried out as part of the SMA2020, with an average abundance of 203 particles per km2 across the whole study area.[69]

2.41

Fidra’s ‘Great Nurdle Hunt’, a citizen science programme gathering data on nurdle pollution across beaches, has reported pellets across the majority of Scotland’s coastlines with hotspots detected across the east coast with frequent occurrences of 101 to 1000 and >1000 nurdles recorded.[77] North Queensferry, a beach located ~12 miles from Ineos Polymers across the Firth of Forth Special Site of Scientific Interest (SSSI), has received media attention for its level of pellet pollution.[78],[79]


Marine-derived sources of litter

2.42

Global estimates suggest that marine-derived litter sources input 0.54 to 5.01 MT of litter into the marine environment every year,[19] with the mid-point for plastic litter inputs as 1.75 MT per year.[13] This comprises a much smaller proportion of marine litter compared to land-derived inputs. The major sources of marine-derived litter are from commercial fishing, aquaculture, recreational fishing and shipping containers.[80],[5]

2.43

Very few estimates exist for the exact contribution of litter from commercial and recreational fishing. The extent of waste generated by such activities is dependent on the scale of such activities and regulatory action.[81] For example, estimates for the seafood industry (comprising commercial fishing, aquaculture and in this instance recreational boating) ranged from 9% in the Mediterranean Sea and Baltic Sea to 42% in the Black Sea.[19] As a proportion of marine-derived litter, the overall estimate is that 22% originated from the fishing sector, whilst 13% originates from the shipping sector.[19]

2.44

Plastic use is widespread in aquaculture for parts of cages, nets and mesh for cages, harvest bins and packaging for feed. Across the European Economic Area (EEA), between 3,000 and 41,000 T of waste is produced from the fishery and aquaculture industries, ~72% of this is likely to be plastic waste.[82] From this, it was estimated that 15% of the total plastic waste is lost to the marine environment likely through mismanagement of waste[120] or after extreme weather.[19] Based on this figure, the total plastic waste emitted into the sea each year from fishing and aquaculture gear can range between 9,888 and 22,685 T.[120]

2.45

Across the OSPAR regions, the highest percentage of maritime-related plastic items as a proportion of items classified in each region was observed in the Greater North Sea (25%), indicating that marine-derived litter is a regular source of litter in this region.[24] As highlighted in Section 6.8, the prevalence of fishing-derived litter on Scottish beaches varies substantially and potentially has a greater influence on more remote beaches in the Highlands and Islands regions. Given this, while there are other sources of marine-derived litter recognised globally (such as shipping, marine coating and paints)[83],[84],[85] only commercial, recreational fishing and aquaculture are considered further in this section.

2.46

KIMO UK’s ‘Fishing for Litter’ scheme in Scotland, which implements OSPAR recommendation 2010/19[86], has recorded over 2000 T of retrieved fishing gear from 2005 to 2021 but this retrieval may only comprise a small proportion of fishing-derived litter.[87] One study combining simple oceanographic circulation parameters with empirical estimates of beach litter for the Scottish Atlantic Coast and North Sea Coast reported that fishing releases ~20 T (four million pieces) of marine litter a year, accounting for ~2% of all marine litter in Scotland.[32] A more recent study estimates this to be much higher with 234 T to 614 T of small fishing-related litter entering the sea annually from demersal fishing along the Scottish Atlantic coast.[88]

2.47

Scotland is the world’s third largest producer of farmed salmon with a significant number of salmon farms on the west coast, in addition to farms for other types of fish and bivalves.[89] Aquaculture has expanded significantly – between 2009 and 2019, global aquaculture production increased by 64% and is projected to double by 2050. Marine litter from aquaculture is expected to increase as a result.[90],[84] No studies on the contribution of Scottish aquaculture to marine litter have been identified.

2.48

Understanding the origins and main pathways of fishing-derived litter, particularly fragments of fishing ropes and nets, ending up on Scottish beaches is inherently difficult. A study examining patterns of fishing debris across UK beaches found that the occurrence of fishing-based litter was most likely explained by a beach’s proximity to fishing ports and fishing grounds.[91]

2.49

Globally, there are various routes in which fishing gear can enter the marine environment and it is generally considered under the classification of abandoned, lost or discarded fishing gear (ALDFG). This could be through fishers losing or abandoning gear when it makes contact with another object (e.g. a vessel), gear conflict (e.g. passive gear is unintentionally towed by a trawl), malfunction of tracking systems, damage through snagging on submerged objects or by marine organisms, loss from bad weather or quick discarding of gear in areas where fishing is illegal.[92],[93] Across the west coast of Scotland, the majority of small fishing sourced beach litter composed of short pieces of net, rope and twine that had been cut and was suggested to be from the mending of nets on board vessels that are then unintentionally lost due to poor waste management on board.[90]

2.50

A study in 2013 conducted by Marine Scotland (now Marine Directorate) aimed to assess the extent of, and possible scenarios resulting in, gear conflict in Scottish inshore waters. Gear conflict was reported to be most prevalent within 3 nautical miles across the South West (Boan, Campeltown and Ayr) and the North West (Kinlochbervie, Lochinver, Ullapool, Portee, Mallaig) regions. Static gear operators (67% of nephrop creelers and 63% using other creels) reported that deliberate intent from other operators was perceived to be the main cause of gear conflict; however, several potential causes of gear conflict were also declared.[94]

2.51One difficulty in quantifying the amount of commercial and recreational fishing gear that may contribute to marine litter is a lack of regular data collection on how much fishing gear is sold, in-use and ultimately lost through ALDFG.[95],[58] A UK-wide gear inventory, carried out by UK devolved governments, industry and stakeholders, estimated that approximately 60,000 T of commercial fishing gear is in use across the UK, and 62,000 T of aquaculture gear. For both fishing and aquaculture gear, the greatest weight of material in use is in Scotland (35,000 T and 44,000 T respectively).[96] Another study estimated that between ~480 and ~1000 T of fishing and aquaculture gear is used in Scotland.[97] This is estimated to generate 5 to 110 T of microplastics from fishing net gear in the sea per year.[98]

2.52

The prevalence of ALDFG and the potential impact of ghost gear[iv] and its wider ecological impacts (see section 3) is recognised by the OSPAR action to tackle this source of marine litter.[99] Gear is now lasting longer once lost or discarded as it is largely produced from synthetic fibres, such as nylon and polyethylene as opposed to historically being composed from natural materials, such as cotton or hemp and therefore needs to be better mitigated.[100]

2.53

In summary, the largest constituent of marine litter, both globally and at a UK-Scotland-level, is land-derived litter. Within this, mismanaged waste, particularly public littering is the greatest contributor transported via inland waterways or deposited directly into the coastal environment. For Scotland, the prevalence of marine- and land-derived litter can be influenced by the type of coastal environment, wind exposure, currents and location. For example, several studies show that fishing-derived litter is a greater pressure across the Highland and Islands coastal regions.

2.54

Microplastics have been reported in surface waters throughout Scotland but attributing microplastics to source is inherently difficult. In the EU, the three greatest sources of microplastics into the marine environment are: tyre wear, treated waste water effluent and plastic pellet (including powders and flakes) loss.

2.55

Fishing-derived litter (originating from recreational, commercial and aquaculture) is the greatest contributor to marine-derived litter across Scotland; however, estimates quantifying its proportion of marine litter in Scotland vary. Fishing-derived marine litter can be a result of gear being abandoned, lost or discarded but there is currently a lack of understanding regarding the major causes of this form of marine litter in Scotland. This is partly due to a lack of regular data collection on how much fishing gear is sold, in-use and ultimately lost through ALDFG.


[i]This study defined inadequately disposed litter as litter that is not formally managed and includes disposal in dumps or open, uncontrolled landfills, where it is not fully contained.

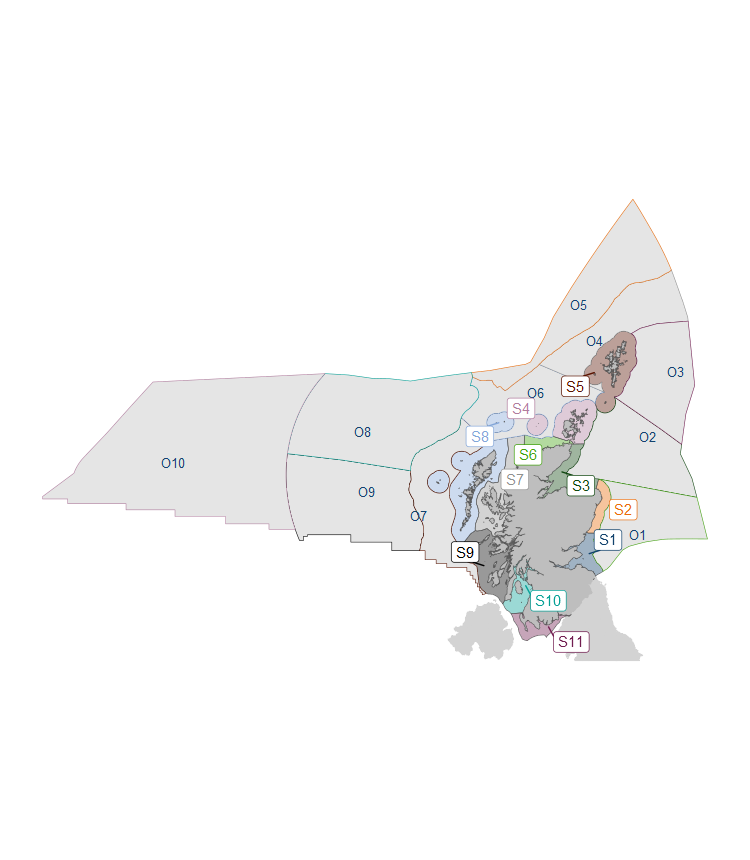
[ii] The 11 Scottish Marine Regions and 10 Offshore Marine Regions represent geographical split of the Scottish Economic Exclusive Zone (0-200 nautical miles), as depicted in The Scottish Marine Regions Order 2015.

[iii] The British Plastics Federation’s current estimate of plastic processed in the UK is 3.5 MT, 1.4 MT lower than the estimate used in the study and state that only 8% of the plastic industry is based in Scotland

[iv] Lost or abandoned gear that continues to ‘fish’ once lost, such as entanglement with marine mammals and habitats, like rocky structures.


[2] Galgani, F., Hanke, G. and Maes, T. “Global distribution, composition and abundance of marine litter.” Marine Anthropogenic Litter, (Springer International Publishing, 2015), 29-56. doi.org:10.1007/978-3-319-16510-3_2.

[3] OSPAR QSR 2023. Abundance, Composition and Trends of Beach Litter. Abundance, Composition and Trends of Beach Litter (ospar.org)

[4] Napper, I.E. and Thompson, R.C. “Plastic Debris in the Marine Environment: History and Future Challenges.” Global Challenges, 4, no. 6 (2020): 1900081. doi:10.1002/gch2.201900081

[5] Li, W. C., TSE, H. F. and Fok, L. “Plastic waste in the marine environment: A review of sources, occurrence and effects.” Science of the Total Environment, 566, (2016): 333-349. doi:10.1016/j.scitotenv.2016.05.084

[6] Plastics Europe. “Plastics – The Facts 2021, An Analysis of European Plastics Production, Demand and Waste Data.” Plastics Europe, Brussels, Belgium, (2022). Plastics – the Facts 2022 • Plastics Europe

[7] Lacerda, A. L. F., Rodrigues, L. dos S., van Sebille, E., Rodrigues, F. L., Ribeiro, L., Secchi, E. R., Kessler, F. and Proietti, M. C. “Plastics in sea surface waters around the Antarctic Peninsula.” Scientific Reports, 9, (2018): 3977. doi:10.1038/s41598-019-40311-4

[8] Bergmann, M., Collard, F., Fabres, J., Gabrielsen, G. W., Provencher, J. F. Rochman, C., van Sebille, E. and Tekman, M. B. “Plastic pollution in the Arctic.” Nature Reviews, 3, no.5 (2022): 323-337. doi:10.1038/s43017-022-00279-8

[9] Taylor, M. L., Gwinnett, C., Robinson, L.F. and Woodall, L. C. “Plastic microfibre ingestion by deep-sea organisms.” Scientific Reports, 6, (2016): 33997. doi:10.1038/srep33997

[10] Haarr, M. L., Falk-Andersson, J. and Fabres, J. “Global marine litter research 2015-2020: Geographical and methodological trends.” Science of the Total Environment, 820, (2022): 153162. doi:10.1016/j.scitotenv.2022.153162

[11] Pham, C.K., Ramirez-Llodra, E., Alt, C.H.S., Amaro, T., Bergmann, M., Canals, M., Company, J.B., Davies, J., Duineveld, G., Galgani, F., Howell, K.L., Huvenna, V. A.I., Isidro, E., Jones, D., O.B., Lastras, G., Morato, T., Gomes-Pereira, J.N., Purser, A., Stewart, H., Tojeira, I., Tabau, X., Van Rooij, D. and Tyler, P.A. “Marine Litter Distribution and Density in European Seas, from the Shelves to Deep Basins.” PLoS One, 9, no.4 (2014): e95839. doi:10.1371/journal.pone.0095839

[12] Tekman, M.B., Wekerle, C., Lorenz, C., Primpke, S., Hasemann, C., Gerdts, G and Bergmann, M. “Tying up Loose Ends of Microplastic Pollution in the Arctic: Distribution from the Sea Surface through the Water Column to Seed-Sea Sediments at the HAUSGARTEN Observatory.” Environmental Science & Technology, 7, no. 54 (2020): 4079-4090. doi:10.1021/acs.est.9b06981

[13] Eunomia. (2016) “Plastics in the Marine Environment”. Plastics in the Marine Environment – Eunomia Research and Consulting pg. 8

[14] Kammann, U., Aust, M.O., Bahl, H and Lang, T. “Marine litter at the seafloor – Abundance and composition in the North Sea and the Baltic Sea.” Marine Pollution Bulletin, 127, (2018): 774-780. doi:10.1016/j.marpolbul.2017.09.051

[15] Jambeck, J.R., Geyer, R., Wilcox, C., Siegler, T.R., Perryman, M., Andrady, A., Narayan, R. and Law, K.L. “Plastic waste inputs from land into the ocean.” Science, 347, no. 6223 (2015): 768-771. doi:10.1126/science.1260352

[16] OSPAR. (2017) “Assessment document of land-based inputs of microplastics in the marine environment.” Pg 16. documents (ospar.org)

[17] Sheavly, S. (2005) “Sixth meeting of the UN Open-ended Informal Consultative Process on Oceans & the Law of the Sea. Marine Debris – an Overview of a Critical Issue for our Oceans.” 6_sheavly.pdf (un.org)

[18] Eunomia (2016) “Study to support the development of measures to combat a range of marine litter sources.” Study to Support the Development of Measures to Combat a Range of Marine Litter Sources – Eunomia Research and Consulting

[19] Meijer, L.J.J., van Emmerik, T., van der Ent, R., Schmidt, C. and Lebreton, L. “More than 1000 rivers account for 80% of global riverine plastic emissions into the ocean.” Science Advances, 7, (2021): eaaz5803. doi:10.1126/sciadv.aaz58

[20] Roebroek, C.T.J., Harrigan, S., van Emmerik, T.H.M., Baugh, C., Eilander, D., Prudhomme, C. and Pappenberger, F. “Plastic in global rivers: are floods making it worse?” Environmental Letters Research, 16, no.2 (2021): 025003. doi:10.1088/1748-9326/abd5df.

[21] Lincoln, S., Andrews, B., Birchenough, S.N.R., Chowdhury, P., Engelhard, G.H., Harrod, O., Pinnegar, J.K. and Townhill, B.L. “Marine litter and climate change: Inextricably connected threats to the world’s oceans.” Science of the Total Environment, 837, (2022): 155709. doi:10.1016/j.scitotenv.2022.155709

[22] Turrell, W.R “Estimating a regional budget of marine plastic litter in order to advise on marine management measures.” Marine Pollution Bulletin, 150, (2020): 110725. doi:10.1016/j.marpolbul.2019.110725

[23] Lacroix, C., André, S., and van Loon, W. (2022). Abundance, Composition and Trends of Beach Litter. In: OSPAR, 2023: “The 2023 Quality Status Report for the North-East Atlantic.” OSPAR Commission, London. Abundance, Composition and Trends of Beach Litter (ospar.org)

[24] Keep Scotland Beautiful. Upstream Battle on the Tay Phase1:2021-2022. upstream-battle-river-tay-phase-1-report.pdf (keepscotlandbeautiful.org)

[25] Keep Scotland Beautiful. Upstream Battle on the Clyde Phase 2 – maintaining momentum. upstream-battle-clyde-phase-2-report.pdf (keepscotlandbeautiful.org)

[26] Marine Conservation Society. (2009) Marine Conservation Society Beachwatch Big Weekend 2009, Final Report, Chapter 2: Methods.

[27] Marine Scotland (2011) Marine Litter Issues, Impacts and Actions. Marine Litter Issues, Impacts and Actions (www.gov.scot)

[28] Zero Waste Scotland. (2013) Scotland’s Litter Problem. Quantifying the scale and cost of litter and flytipping. Pg. 20 Scotland’s Litter Problem (zerowastescotland.org.uk)

[29] Zero Waste Scotland. (2017). Evidence Review of Flytipping Behaviour. Pg. 5 *mf-qj9zglno-1676977132d (zerowastescotland.org.uk)

[30] Turrell, W.R. “Spatial distribution of foreshore litter on the northwest European continental shelf.” Marine Pollution Bulletin, 142, (2019): 583-594. doi:10.1126/science.1260352

[31] Turrell, W.R “Estimating a regional budget of marine plastic litter in order to advise on marine management measures.” Marine Pollution Bulletin, 150, (2020): 110725. doi:10.1016/j.marpolbul.2019.110725

[32] Allison, N.I., Dale, A.C., Turrell, W.R. and Narayanaswamy, B.E. “Modelled and observed plastic pollution on remote Scottish beaches: The importance of local marine sources.” Marine Pollution Bulletin, 194, (2023): 115341. doi:10.1016/j.marpolbul.2023.115341

[33] Nelms, S.E., Coombes, C., Foster, L.C., Galloway, T.S., Godley, B.J., Lindeque, P.K. and Witt, M.J. “Marine anthropogenic litter on British beaches: A 10-year nationwide assessment using citizen science data.” Science of the Total Environment, 579, (2017): 1399-1409. doi:10.1016/j.scitotenv.2016.11.137

[34] Scottish Islands Federation. SIF Marine Litter Summer Data Collection. SIF Marine Litter Summer Data Collection – The Scottish Islands Federation (scottish-islands-federation.co.uk) Accessed 21 March 2024.

[35] Buckingham, J., Capper, A. and Bell, M. “The missing sink – quantification, categorisation and sourcing of beached macro-debris in the Scottish Orkney Islands.” Marine Pollution Bulletin, 157, (2020): 111364. doi:10.1016/j.marpolbul.2020.111364

[36] Defra (2022) UK Marine Strategy / OSPAR Beach Litter Monitoring Data Collection – ME5438 (defra.gov.uk)

[37] S. Kinsey. “Beach Litter- Abundance, Composition and Trends.” (2018) UK Marine Online Assessment Tool Beach litter – Marine online assessment tool (cefas.co.uk)

[38] Storrier, K.L., McGlashan, D.J., Bonellie, S., Velander, K. “Beach Litter Deposition at a Selection of Beaches in the Firth of Forth, Scotland.” Journal of Coastal Research, 23, (2007): pp. 813-822. doi:10.2112/04-0251.1.

[39] OSPAR Commission. (2019) Review of BAT and BEP in Urban Wastewater Treatment Systems focusing on the reductions and prevention of stormwater related litter, including micro-plastics, entering the Marine Environment. *documents (ospar.org)

[40] Alimba, C.G and Faggio, C. “Microplastics in the marine environment: Current trends in environmental pollution and mechanisms of toxicological profile.” Environmental Toxicology and Pharmacology, 68, (2019): 61-74. doi:10.1016/j.etap.2019.03.001

[41] Bakir, A., Doran, D., Silburn, B., Russell, J., Archer-Rand, S., Barry, J., Maes, T., Limpenny, C., Mason, C., Barber, J and Manuel Nicolaus, E.E. “A spatial and temporal assessment of microplastics in seafloor sediments: A case study for the UK.” Frontiers in Marine Science, 9, (2023): 1093815. doi:10.3389/fmars.2022.1093815

[42] Catarino, A.I., Kramm, J., Volker, C., Henry, T.B and Everaert, G. “Risk posed by microplastics and public perception.” Current Opinion in Green and Sustainable Chemistry, 29, (2021): 100467. doi: 10.1016/j.cogsc.2021.100467

[43] Boucher, J and Friot, D. “Primary Microplastics in the Oceans: a Global Evaluation of Sources.” Gland, Switzerland: IUCN, (2017), 43pp. 2017-002-En.pdf (iucn.org)

[44] Bohdan, K. “Estimating global marine surface microplastic abundance: systematic literature review.” Science of the Total Environment, 832, (2022): 155064 doi:10.1016/j.scitotenv.2022.155064

[45] Scottish Marine Assessment 2020. Microplastics in surface water | Scotland’s Marine Assessment 2020

[46] Russell, M. and Webster, L. “Microplastics in sea surface waters around Scotland.” Marine Pollution Bulletin, 166, (2021): 112210. doi:10.1016/j.marpolbul.2021.112210

[47] Whitehead, P.G., Bussi., G., Hughes, J.M.R., Castro-Castellon, A.T., Norling, M.D., Jeffers, E.S., Rampley, C.P.N., Read, D.S. and Horton, A.A. “Modelling Microplastics in the River Thames: Sources, Sinks and Policy Implications.” Water 13, no. 6 (2021): 861. doi:10.3390/w13060861

[48] Murphy, F., Ewins, C., Carbonnier, F. and Quinn, B. “Wastewater Treatment Works (WwTW) as a source of Microplastics in the Aquatic Environment.” Environmental Science and Technology, 50, (2016): 5800-5808. doi:10.1021/acs.est.5b05416

[49] Scottish Marine Assessment 2020. Microplastics in surface waters. Microplastics in surface water | Scotland’s Marine Assessment 2020

[50] Higgins, C. and Turner, A. “Microplastics in surface coastal waters around Plymouth, UK, and the contribution of boating and shipping activities.” Science of the Total Environment, 893, (2023): 164695. doi: 10.1016/j.scitotenv.2023.164695

[50] Kukkola, A.T., Senior, G., Maes, T., Silburn, B., Bakir, A., Kroger, S. and Mayes, A.G. “A large-scale study of microplastic abundance in sediment cores from the UK continental shelf and slope.” Marine Pollution Bulletin, 178, (2022): 113554. doi:10.1016/j.marpolbul.2022.113554

[52] Devereux, R., Ayati, B., Westhead, E.K., Jayaratne, R. and Newport, D. ““The great source” microplastic abundance and characteristics along the river Thames.” Marine Pollution Bulletin, 191, (2023): 114965. doi:10.1016/j.marpolbul.2023.114965

[53] Nel, H.A., Sambrook Smith, G.H., Harmer, R., Sykes, R., Schneidewind, U., Lynch, I. and Krause, S. “Citizen Science reveals microplastic hotspots within tidal estuaries and the remote Scilly Islands, United Kingdom.” Marine Pollution Bulletin, 161, (2020): 111776. doi:10.1016/j.marpolbul.2020.111776

[54] Gallagher, A., Rees, A., Rowe, R., Stevens, J. and Wright, P. “Microplastics in the Solent estuarine complex, UK: An initial assessment.” Marine Pollution Bulletin, 102, (2016): 243-249. doi:10.1016/j.marpolbul.2015.04.002

[55] Brumenroder, J., Sechet, P., Kakkonen, J.E. and Hartl, M.G.J. “Microplastic contamination of intertidal sediments of Scapa Flow, Orkney: A first assessment.” Marine Pollution Bulletin, 124, no. 1 (2017): 112-120. doi:10.1016/j.marpolbul.2017.07.009

[56] Napper, I.E. and Thompson, R.C. “Plastic Debris in the Marine Environment: History and Future Challenges.” Global Challenges, 4, no. 6 (2020): 1900081. doi:10.1002/gch2.201900081

[57] Eunomia and ICF. “Investigating options for reducing releases in the aquatic environment of microplastics emitted by (but not intentionally added in) products” (2018) Investigating Options for Reducing Releases in the Aquatic Environment of Microplastics Emitted by Products – Eunomia

[58] OSPAR Commission. “Assessment document of land-based inputs of microplastics in the marine environment.” (2017) documents (ospar.org)

[59] Kole, P.J., Lohr, A.J., Van Belleghem, F.G.A.J. and Ragas, A.M.J. “Wear and Tear of Tyres: A Stealthy Source of Microplastics in the Environment.” International Journal of Environmental Research and Public Health, 14, (2017): 1265. doi:10.3390/ijerph14101265. Pg. 13. Table 13.

[60] Sun, J., Dai, X., Wang, Q., van Loosdrecht, M. C. M. and Ni, B-J. “Microplastics in wastewater treatment plants: Detection, occurrence, and removal.” Water Research, 152, (2019): 21-37. doi:10.1016/j.watres.2018.12.050

[61] Radford, F., Horton, A., Hudson, M., Shaw. P. and Williams, I. “Agricultural soils and microplastics: Are biosolids the problem?” Frontiers in Soil Science, 2, (2023): 941837. doi: 10.3389/fsoil.2022.941837

[62] Carr, S. A., Liu, J. and Tesoro, A. G. “Transport and fate of microplastic particles in wastewater treatment plants.” Water Research, 91, (2016): 174-182. doi:10.1016/j.watres.2016.01.002

[63] Gies, E. A., LeNoble, J., Noël, M., Etemadifar, A., Bishay, F., Hall, E. R. and Ross, P. S. “Retention of microplastics in a major secondary wastewater treatment plant in Vancouver, Canada.” Marine Pollution Bulletin, 133, (2018): 553-561. doi:10.1016/j.marpolbul.2018.06.006

[64] UK Water Industry Research. The National Chemical Investigations Programme 2020-2022, Volume 2,

“Investigations into the fate and behaviour of microplastics within wastewater treatment works.” (2022). Prepared by the UK Centre for Ecology and Hydrology. The National Chemical Investigations Programme 2020-2022 Volume 2 – Investigations into the fate and behaviour of Microplastics within wastewater treatment works (ukwir.org)

[65] Horton, A. A., Cross, R. K., Read, D. S., Jürgens, M. D., Ball, H. L., Svendsen, C., Vollertsen, J. and Johnson, A. C. “Semi-automated analysis of microplastics in complex wastewater samples.” Environmental Pollution, 268, (2020): 115841. doi:10.1016/j.envpol.2020.115841

[66] Mason, S. A., Garneau, D., Sutton, R., Chu, Y., Ehmann, K., Barnes, J., Fink, P., Papazissimos, D. and Rogers, D. L. “Microplastic pollution is widely detected in US municipal wastewater treatment plant effluent.” Environmental Pollution, 218, (2016): 1045-1054. doi:10.1016/j.envpol.2016.08.056

[67] Iyare, P. U., Ouki, S. K and Bond, T. “Microplastics removal in wastewater treatment plants: a critical review.” Environmental Science Water Research and Technology, 6, (2020): 2664. doi:10.1039/d0ew00397b

[68] Karlsson, T.M., Arneborg, L., Broström, G., Carney Almroth, B., Gipperth, L and Hassellöv, M. “The unaccountability case of plastic pellet production.” Marine Pollution Bulletin, 129, (2018): 52-60. doi:10.1016/j.marpolbul.2018.01.041

[69] British Plastics Federation. Operation Clean Sweep. Plastic Pellet Loss Prevention. Operation Clean Sweep® Manual & Guidelines – Operation Clean Sweep® (opcleansweep.org.au) Accessed: January 19, 2024.

[70] European Commission. “Impact Assessment Report. Combatting microplastic pollution in the European Union.” (2023). Section 2.4.2 EUR-Lex – 52023SC0332 – EN – EUR-Lex (europa.eu)

[71] Pruter, A.T. “Sources, quantities and distribution of persistent plastics in the marine environment.” Marine Pollution Bulletin, 18, no. 6 (1987): 305-310. doi:10.1016/S0025-326X(87)80016-4

[72] Mani, T., Hauk, A., Walter, U. and Burkhardt-Holm, P. “Microplastics profile along the Rhine River.” Scientific Reports, 5, (2015): 17988. doi:10.1038/srep17988

[73] Lechner, A., Keckeis, H., Lumesberger-Loisl, F., Zens, B., Krusch, R., Tritthart, M., Glas, M. and Schludermann, E. “The Danube so colourful: A potpourri of plastic litter outnumbers fish larvae in Europe’s second largest river.” Environmental Pollution, 188, (2014): 177-181. doi:10.1016/j.envpol.2014.02.006

[74] Eunomia. “Study to Quantify Pellet Emissions in the UK”. A report by Eunomia for Fidra. (2016). Study to Quantify Pellet Emissions in the UK – Eunomia.

[75] British Plastics Federation About The British Plastics Industry (bpf.co.uk) Accessed: January 22, 2024.

[76] Storrier, K. L., McGlashan, D. J., Bonellie, S. and Velander, K. “Beach Litter Deposition at a Selection of Beaches in the First of Forth, Scotland.” Journal of Coastal Research, 23, (2007): 813-822. doi:10.2112/04-0251.1

[77] Nurdle Map, The Great Nurdle Hunt. Nurdle Map (nurdlehunt.org.uk) Accessed: March 21, 2024.

[78] Fife beach ‘worst’ for nurdle pollution – BBC News. Accessed: December 13, 2023.

[79] Uncovering Nurdles In North Queensferry – Stop The Plastic Tide – The Scots Magazine Accessed: December 18, 2023.

[80] Galafassi, S., Nizzetto, L. and Volta, P. “Plastic sources: A survey across scientific and grey literature for their inventory and relative contribution to microplastics pollution in natural environments, with an emphasis on surface water.” Science of the Total Environment, 693, (2019): 133499. doi: 10.1016/j.scitotenv.2019.07.305

[81] OSPAR Commission. “Scoping study to identify key waste items from the fishing industry and aquaculture.” Marine Litter Regional Action Plan. Action 35 (2019) documents (ospar.org)

[82] T Huntington, “Marine Litter and Aquaculture Gear – White Paper.” Report Produced by Poseidon Aquatic Resources Management Ltd for the Aquaculture Stewardship Council, 2019, 13-16. ASC_Marine-Litter-and-Aquaculture-Gear-November-2019.pdf (asc-aqua.org)

[83] GESAMP. “Sea-based sources of marine litter”, (Gilardi, K., ed.) (IMO/FAO/UNESCO-IOC/UNIDO/ WMO/IAEA/UN/UNEP/UNDP/ISA Joint Group of Experts on the Scientific Aspects of Marine Environmental Protection). Rep. Stud. GESAMP No. 108, (2021): 109 p. Sea-based sources of marine litter | GESAMP

[84] Turner, A. “Marine Pollution from antifouling paint particles.” Marine Pollution Bulletin, 60, (2010): 159-171. doi:10.1016/j.marpolbul.2009.12.004

[85] Kotrikla, A. “Environmental management aspects for TBT antifouling wastes from the shipyards.” Journal of Environmental Management, 90, (2009): s77-s85. doi:10.1016/j.jenvman.2008.07.017

[86] OSPAR Commission. Action 53: Fishing for Litter | OSPAR Commission Accessed: 19 April 2024

[87] Overview reporting Implementation of OSPAR Recommendation 2016/01 on the reduction of marine litter through the implementation of fishing for Litter initiatives. documents (ospar.org)

[88] Allison, N.L., Dale, A.C., Narayanaswamy, B.E. and Turrell, W.R. “Investigating local trawl fishing as a source of plastic beach litter.” Marine Pollution Bulletin, 205, (2024): 116627. doi: 10.1016/j.marpolbul.2024.116627

[89] Natural Scotland, “Scotland’s Aquaculture” Scotland’s Aquaculture | Our Aquaculture, 2021. Scotland’s Aquaculture | Our Aquaculture

[90] Skirtun, M., Sandra, M., Strietman, W.J., van de Burg, S.W.K., De Raedemaecker, F. and Devriese, L.I. “Plastic Pollution Pathways from Marine Aquaculture Practices and Potential Solutions for the North-East Atlantic Region.” Marine Pollution Bulletin 174 (January 2022): 113178, doi:10.1016/j.marpolbul.2021.113178

[91] Unger, A. and Harrison, N. “Fisheries as a source of marine debris on beaches in the United Kingdom.” Marine Pollution Bulletin, 107, (2016): 52-58. doi: 10.1016/j.marpolbul.2016.04.024

[92] Gilman, E. “Status of international monitoring and management of abandoned, lost and discarded fishing gear and ghost fishing.” Marine Policy, 60, (2015): 225-239. doi:10.1016/j.marpol.2015.06.016

[93] Richardson, K., Hardesty, B.D., Vince, J.Z. and Wilcox, C. “Global Causes, Drivers and Prevention Measures for Lost Fishing Gear.” Frontiers in Marine Science, 8, (2021): 690447. doi:10.3389/fmars.2021.690447

[94] Riddgington, G., Radford, A. and Gibson, H. “Management of the Scottish Inshore Fisheries; Assessing the Options for Change.” Technical Report prepared for Marine Scotland. (2014). Management of The Scottish Inshore Fisheries; Assessing The Options for Change – Technical Reports (www.gov.scot)

[95] Resource Futures. Mapping Economic, Behavioural and Social Factors within the Plastic Value Chain that lead to Marine Litter in Scotland. Commercial fishing gear report prepared for the Scottish Government. (2019). Summary report (www.gov.scot)

[96] Defra, Marine Scotland, Welsh Government. “Policy Options for Fishing and Aquaculture Gear in the UK Phase1: Gear inventory.” ME5240. October 2021. Policy Options for Fishing and Aquaculture Gear | Resource Futures

[97] Eunomia (2019) “Understanding Microplastics in the Scottish Environment. The sources, fate and environmental impact of microplastics in the Scottish terrestrial, freshwater and marine environment.” Pg. 65-66

[98] Eunomia “Understanding Microplastics in the Scottish Environment. The sources, fate and environmental impact of microplastics in the Scottish terrestrial, freshwater and marine environment.” A report by Eunomia for Scottish Environment Protection Agency. (2019) Understanding Microplastics in the Scottish Environment – Eunomia Research and Consulting Pg. 65-66

[99] OSPAR Commission. Action 56: Abandoned, Lost, Discarded Fishing Gear – snagging sites and historic dumping grounds. Action 56: Abandoned, lost, discarded fishing gear – Snagging sites and historic dumping grounds | OSPAR Commission

[100] Wright, L.S., Napper, I.E. and Thompson, R.C. “Potential microplastic release from beached fishing gear in Great Britain’s region of highest fishing litter density.” Marine Pollution Bulletin, 173, (2021): 113115. doi:10.1016/j.marpolbul.2021.113115

[120] Chapron, L., Peru, E., Engler, A., Ghiglione, J.F., Meistertzheim, A.L., Pruski, A.M., Purser, A., Vetion, G., Galand, G.E. and Lartaud, F. “Macro- and microplastics affect cold-water corals growth, feeding and behaviour.” Scientific Reports, 8, (2018): 15299. doi:10.1038/s41598-018-33683-6

  • 29 October 2024

3. The ecological impacts of marine litter are well evidenced and indisputable

3.1

As early as the 1970’s scientific studies have demonstrated the potential ecological interactions between marine species and plastic pollution, reporting early records of ingestion in birds[101],[102], turtles[103] and fish[104] and entanglement with marine mammals[105],[106] as a few examples. One of the first dedicated scientific reviews summarising the known deleterious effects of plastic litter was then published in 2002.[107] Decades on, ecological impacts persist. Up to 2015 there have been 44,000 cases of ingestion and entanglement with marine debris affecting 1,400 marine species recorded in literature[108] – signifying its longstanding and detrimental impact on marine life.

3.2

For entanglement, marine animals can be attracted to or accidentally entangled with discards and lost material from commercial fishing activities, such as set and drift nets, rope and lines, and plastic packaging loops. Direct impacts from entanglement include mortality through drowning, injury or starvation.[109]

3.3

Across Scottish-focused studies, there is also evidence of microplastic uptake in marine organisms, including fish[110] and crustaceans.[111] One study found that ~11% of organisms in the East Mingulay SAC in the Outer Hebrides, had ingested microplastics.[112] Another study found that ~50% of aquatic macroinvertebrates sampled in Scotland’s freshwater environments contained microplastics.[113] Levels of microplastic ingestion has been shown to vary in fish, with higher ingestion in coastal areas than deeper waters across Scottish marine areas.[112]

3.4

For seabirds, ingestion of marine plastic litter is well evidenced. A review of studies across the North-East Atlantic, including Scottish marine areas, found that 74% of bird species studied in the area had ingested plastic. However, authors note that only 49% of all species in this area had been studied, limiting knowledge of overall plastic ingestion for the area.[114] The review also reports several studies in which seabirds have been evidenced to incorporate plastics into their nests.[116] Over 80% of gannet nests in Wales between 1996 to 1997 and 2005 to 2010 contained plastic, largely synthetic rope, and this led to the entanglement of 63 bird (adults and chicks) per year on average.[115] Such mortality will likely only increase with the expected increase in physical marine pollution.[116] ­­

3.5

Ingestion of marine plastic has been shown to have indirect impacts, such as reduced body condition and feeding rates,[116] build-up of ingestible matter (i.e. bioaccumulation)[v] in fish, invertebrates and marine mammals,[117] and impact the burrowing activity of lugworms.[99] A study in the North Sea found that nine of 22 sperm whale carcasses investigated contained marine debris including netting, ropes, foils, packaging and part of a car although none of these items were responsible for the death of the animals.[118]

3.6

Marine litter has also been shown to have potential impacts on Priority Marine Features[vi] classified for their ecological importance. A study carried out in Orkney found that microplastics can adhere to seagrass and over 80% of the marine biota collected from the seagrass beds contained microplastics.[119] Exposure to microplastics has been shown to have a potential effect on the growth rates and tissue health of cold-water corals native to Scotland.[120] Cold-water coral species classified as Species of Principal Importance in England have also been found to get caught up in and damaged by ghost fishing gear and other marine litter in the seas around South West England.[121]

3.7

Changes to individual species behaviour, such as feeding and growth rates, can represent a response to environmental stress and be indicative of potential ecosystem-level effects. However, extrapolating these impacts to ecosystem functioning remains challenging due to the inability to measure and model such processes on a global scale.[122] Microplastics have been suggested to have an impact on ecosystem function in oyster-dominated muddy sediment environments following a decrease in biomass and a change in ecosystem composition under mesocosm conditions. Another study found that microplastics had little impact on the oysters but the total number of organisms in these ecosystems decreased by up to a third when affected by microplastics.[123]

3.8

Other affects related to microplastics observed outside Scotland and identified in literature reviews include immune responses in mussels,[47] immobilisation of zooplankton,[124] disruption of filtration and digestive systems, cell death, DNA damage, oxidative stress, effects on growth and reproduction, effects on swimming and population decline across a variety of species.[125]


Emerging threats from marine pollution

3.9

In addition to the direct threats posed by marine litter, emerging threats associated with the degradation of marine litter are being increasingly recognised. The breakdown of plastics in the marine environment when exposed to natural UV light can release harmful contaminants, either those added during the manufacturing of plastics or those which can adsorb to the surface of plastic.

3.10

For example, plasticizers, such as bisphenols (including BPA) and phthalates that are added to plastic for hardness, can be released over time.[126] Studies have found phthalates in fish and shellfish in Scotland, with greater occurrences observed in marine fish than freshwater fish.[127] Rubber particles from tyres can also release harmful compounds after exposure to ozone that pose a risk to marine life.[128] For example, 6PPD quinone is formed from tyre debris and has been linked to salmon deaths[129] and rainbow trout deaths in the US.[129]

3.11

Micro and nanoplastics have been found to be a vector for adsorbed contaminants that have been shown to have detrimental impacts on marine life through ingestion and bioaccumulation up the food chain,[130],[131] or through direct release into the water.[132] Adsorbed chemicals include: heavy metals, pesticides, organic compounds, hydrocarbons, medicines, persistent organic pollutants (POPs) and phthaltes.[131],[132],[133],[134],[135] The range of contaminants that can be adsorbed have been found to be carcinogenic, cause cardiovascular disease and be endocrine disruptors.[131]

3.12

As well as transporting adsorbed contaminants, one study reports that anthropogenic flotsam[vii] is the third most common vector for invasive non-native species (INNS) in the UK accounting for 9% of alien species.[136] Plastics have a greater capacity for carrying INNS than other non-plastic vectors.[137],[138] Invasive species pose a risk to biodiversity and ecosystem services. Floating debris can introduce INNS both from outside an ecosystem and spread an alien species within an already affected area.[138] While this process has historically occurred on natural material, anthropogenic litter had significantly increased the number of available vectors for transporting INNS.[138]

3.13

Marine litter may also be a potential vector for organisms that cause disease (pathogens).[139] Microorganisms form films, called biofilms, on objects. A literature review of global studies found that pathogenic bacteria of the Vibrio species were carried on marine microplastics in 15 studies from the Sungo Bay in China, North Atlantic, North Sea, Baltic Sea, Bay of Brest in France and the Mediterranean.[140] Other pathogens have also been identified on microplastics including Campylobateraceae, Aeromonas, Pseudoalteromonas, Tenacibaculum, Pseudomanas, Furunculosis and Phormidium. [140]


Potential impacts on human health

3.14

Marine litter can also impact human life through a variety of ways, including the eyesore of visual pollution, boat entanglement with fishing gear, and boats colliding with larger pieces of debris or getting debris tangled around propellors. Microplastics can also enter the human body via inhalation, ingestion or through the skin.[140] Perhaps most significant is the potential effects on human health caused by the indirect ingestion of microplastics through the consumption of seafood.

3.15

Microplastics can accumulate in seafood. This is most notable for shellfish as they filter large amounts of seawater when feeding, leading to a build-up of microplastics within them. In the UK, a study found that 341 particles/person/year of microplastic were ingested from seafood. This is a similar amount to Belgium (479 particles/person/year) and South Korea (521 particles/person/year) and within the range identified in France (145 to 1,139 particles/person/year).[141] In Italy, where shellfish consumption and the levels of microplastics in market samples of fish are higher, ingestion was found to be 11,970 particles/person/year.[109],[142]

3.16

The chemical additives in microplastics and adsorbed contaminants may also pose a risk to human health when consuming seafood containing microplastic. While the impacts of the individual contaminants are often well understood, the dose of chemicals to humans from microplastics in seafood and the health implications are not well understood.[142]

3.17

A recent study suggests that patients identified as having micro and nanoplastics within the plaque of certain arteries were at greater risk of strokes, heart attacks or death.[143] Another study showed that human cells exposed to micro and nanoplastics were found to show cytotoxic reactions.[109] However, attributing a link between the consumption of marine organisms containing microplastic and adverse health outcomes and quantifying the impact of marine microplastics on human health is challenging.

3.18

Research into the human health impacts of such contaminants through consumption of seafood are still in its infancy. While current evidence suggests that microplastic pollution does not pose a widespread risk to humans, experts have called for the precautionary principle to be invoked in assessing potential risks to human health.[144]

3.19

Microplastics may also act as a vector for pathogens, which poses a risk to consumers of seafood and staff in aquaculture sites; however, the risk has not been quantified.[140] A study of five EU designated bathing beaches on the Forth Estuary found that plastic pellets (‘nurdles’) act as a vector for Escherichia coli and pathogenic bacteria such as species of Vibrio. Nurdles colonised by both coli and Vibrio species were found on all five beaches. Vibrio colonisation was over 75% at four of the beaches. This is thought to be caused by biofilms covering the nurdles in contaminated seawater.[145]

3.20

Microplastics may, therefore, indirectly lead to a reduction of bathing water quality under the EU Bathing Water Directive. Poor quality bathing water can lead to gastrointestinal symptoms, respiratory diseases and eye, nose and throat infections.[146]


[v] The build-up of a chemical when an animal consumes it more quickly than it can excrete it, resulting in higher levels of the chemical further up the food chain

[vi] Priority Marine Features are features characteristic of the Scottish marine environment that have conservation importance.

[vii] debris associated with vessels that has been released into the marine environment unintentionally, such as during a shipwreck or accident.


[47] Whitehead, P.G., Bussi., G., Hughes, J.M.R., Castro-Castellon, A.T., Norling, M.D., Jeffers, E.S., Rampley, C.P.N., Read, D.S. and Horton, A.A. “Modelling Microplastics in the River Thames: Sources, Sinks and Policy Implications.” Water 13, no. 6 (2021): 861. doi:10.3390/w13060861

[99] OSPAR Commission. Action 56: Abandoned, Lost, Discarded Fishing Gear – snagging sites and historic dumping grounds. Action 56: Abandoned, lost, discarded fishing gear – Snagging sites and historic dumping grounds | OSPAR Commission

[101] Ryan, P. G. “The effects of ingested plastic on seabirds: Correlations between plastic load and body condition.” Environmental Pollution, 2, (1987): 119-125. doi:10.1016/0269-7491(87)90197-7

[102] Van Franeker, J. A. “Plastic ingestion in the North Atlantic fulmar.” Marine Pollution Bulletin, 9, (1985): 367-369. doi:10.1016/0025-326X(85)90090-6

[103] Gramentz, D. “Involvement of loggerhead turtle with the plastic, metal, and hydrocarbon pollution in the central Mediterranean.” Marine Pollution Bulletin, 1, (1988): 11-13. doi:10.1016/0025-326X(88)90746-1

[104] Carpenter, E. J., Anderson, S. J., Harvey, G. R., Miklas, H. P., Beck, B. P. “Polystyrene Spherules in Coastal Waters.” Science, 178, (1972): 749-750. doi:10.1126/science.178.4062.749

[105] Fowler, C. W. “Marine debris and northern fur seals: A case study.” Marine Pollution Bulletin, 6, (1987): 326-335. doi:10.1016/S0025-326X(87)80020-6

[106] Conner, D. K. and O’dell, R. “The Tightening Net of Marine Plastics Pollution.” Environment: Science and Policy for Sustainable Development, 1, (1988): 16-36. doi:10.1080/00139157.1988.9930865

[107] Derraik, J. G.B. “The pollution of the marine environment by plastic debris: a review.” Marine Pollution Bulletin, 9, (2002): 842-852. doi:10.1016/S0025-326X(02)00220-5

[108] Agamuthu, P., Mehran, SB., Norkhairah, A. and Norkhairiyah, A. “Marine debris: A review of impacts and global initiatives.” Waste Management and Research, 37, (2019): 987-1002. doi:10.1177/0734242X19845041

[109] Murray R. Gregory, “Environmental Implications of Plastic Debris in Marine Settings—Entanglement, Ingestion, Smothering, Hangers-on, Hitch-Hiking and Alien Invasions.” Philosophical Transactions of the Royal Society B: Biological Sciences 364, no. 1526 (2009): 2013–25, doi:10.1098/rstb.2008.0265

[110] Murphy, F., Russell, M., Ewins, C. and Quinn, B. “The Uptake of Macroplastic & Microplastic by Demersal & Pelagic Fish in the Northeast Atlantic around Scotland.” Marine Pollution Bulletin 122, no. 1–2 (2017): 353–59, doi:10.1016/j.marpolbul.2017.06.073354.

[111] Murray, F. and Cowie, P.R. “Plastic Contamination in the Decapod Crustacean Nephrops norvegicus (Linnaeus, 1758).” Marine Pollution Bulletin, 62, (2011): 1207-1217. doi:10.1016/j.marpolbul.2011.03.032

[112] La Beur, L., Henry, L-A., Kazanidis, G., Hennige, S., McDonald, A., Shaver, M.P. and Roberts, J. “Baseline Assessment of Marine Litter and Microplastic Ingestion by Cold-Water Coral Reef Benthos at the East Mingulay Marine Protected Area (Sea of the Hebrides, Western Scotland).” Frontiers in Marine Science 6 (2019): 80. doi:10.3389/fmars.2019.00080

[113] Windsor, F.M., Tilley, R.M., Tyler, C.R. and Ormerod, S.J. “Microplastic ingestion by riverine macroinvertebrates.” Science of the Total Environment, 586, (2019): 127-141. doi:10.1016/j.scitotenv.2018.07.271

[114] Nina J. O’Hanlon et al., “Seabirds and Marine Plastic Debris in the Northeastern Atlantic: A Synthesis and Recommendations for Monitoring and Research.” Environmental Pollution 231 (2017): 1291–1301. doi:10.1016/j.envpol.2017.08.101

[115] Votier, S.C., Archibald, K., Morgan, G. and Morgan, L. “The Use of Plastic Debris as Nesting Material by a Colonial Seabird and Associated Entanglement Mortality.” Marine Pollution Bulletin 62, no. 1 (2011): 168–72, doi:10.1016/j.marpolbul.2010.11.009

[116] Natalie A.C. Welden and Phillip R. Cowie, “Long-Term Microplastic Retention Causes Reduced Body Condition in the Langoustine, Nephrops Norvegicus.” Environmental Pollution 218 (2016): 895–900. doi:10.1016/j.envpol.2016.08.020

[117] Miller, M.E., Hamann, M. and Kroon, F.J. “Bioaccumulation and biomagnification of microplastics in marine organisms: A review and meta-analysis of current data.” PLoS One, 15, (2020): e0240792. doi:10.1371/journal.pone.0240792

[118] Unger, B., Bravo Rebolledo, E.L., Deaville, R., Grone, A., Ijsseldijk, L.I., Leopold, M.F., Siebert, U., Spitz, J., Wohlsein, P. and Herr, H. “Large amounts of marine debris found in sperm whales stranded along the North Sea coast in early 2016.” Marine Pollution Bulletin 112, no 1-2 (2016): 134-141. doi:10.1016/j.marpolbul.2016.08.027

[119] Jones, K.J., Hartl, M.G.J., Bell, M.C. and Capper, A. “Microplastic Accumulation in a Zostera Marina L. Bed at Deerness Sound, Orkney, Scotland.” Marine Pollution Bulletin 152 (2020): 110883, doi:10.1016/j.marpolbul.2020.110883.

[120] Chapron, L., Peru, E., Engler, A., Ghiglione, J.F., Meistertzheim, A.L., Pruski, A.M., Purser, A., Vetion, G., Galand, G.E. and Lartaud, F. “Macro- and microplastics affect cold-water corals growth, feeding and behaviour.” Scientific Reports, 8, (2018): 15299. doi:10.1038/s41598-018-33683-6

[121] Sheehan, E.V., Rees, A., Bridger, D, Williams, T and Hall-Spencer, J.M. “Strandings of NE Atlantic gorgonians.” Biological Conservation, Volume 209 (2017): 482-487. doi:10.1016/j.biocon.2017.03.020

[122] Galloway, T.S., Cole, M. and Lewis, C. “Interaction of microplastic debris throughout the marine ecosystem.” Nature ecology and evolution, 1, (2017): 0116. doi:10.1038/s41559-017-0116

[123] Green, D.S. “Effects of microplastics on European flat oysters, Ostrea edulis and their associated benthic communities.” Environmental Pollution, 216, (2016): 95-103. doi:10.1016/j.envpol.2016.05.043

[124] Frydkjær, C.K., Iversen, N. and Roslev, P. “Ingestion and Egestion of Microplastics by the Cladoceran Daphnia Magna: Effects of Regular and Irregular Shaped Plastic and Sorbed Phenanthrene.” Bulletin of Environmental Contamination and Toxicology 99, no. 6 (2017): 655–61. doi:10.1007/s00128-017-2186-3

[125] Anbumani, S and Kakkar, P. “Ecotoxicological Effects of Microplastics on Biota: A Review.” Environmental Science and Pollution Research 25, no. 15 (2018): 14373–96. doi:10.1007/s11356-018-1999-x

[126] Fauvelle, V., Garel, M., Tamburini, C., Nerini, D., Castro-Jimenez, C., Schmidt, N., Paluselli, A., Fahs, A., Papillon, L., Booth, A.M. and Sempere, R. “Organic Additive Release from Plastic to Seawater Is Lower under Deep-Sea Conditions.” Nature Communications 12, no. 1 (2021). doi:10.1038/s41467-021-24738-w

[127] Food and Environment Research Agency, FD 09/01 Investigation into the Levels of Environmental Contaminants in Scottish Marine and Freshwater Fin Fish and Shellfish (2009), 37.

[128] Tian, Z., et al., “A Ubiquitous Tire Rubber–Derived Chemical Induces Acute Mortality in Coho Salmon.” Science 371, no. 6525 (2021): 185–89. doi:10.1126/science.abd6951

[129] Brinkmann, M., et al., “Acute Toxicity of the Tire Rubber-Derived Chemical 6PPD-Quinone to Four Fishes of Commercial, Cultural, and Ecological Importance.” Environmental Science &amp; Technology Letters 9, no. 4 (2022): 333–38. doi:10.1021/acs.estlett.2c00050.

[130] Lionetto, F. and Esposito Corcione, C. “An Overview of the Sorption Studies of Contaminants on Poly(Ethylene Terephthalate) Microplastics in the Marine Environment.” Journal of Marine Science and Engineering 9, no. 4 (2021): 445. doi:10.3390/jmse9040445

[131] Cássio, F., Batista, D. and Pradhan, A. “Plastic Interactions with Pollutants and Consequences to Aquatic Ecosystems: What We Know and What We Do Not Know.” Biomolecules 12, no. 6 (2022): 798. doi:10.3390/biom12060798

[132] Susanto Barus, B., Chen, K., Cai, M., Li, R., Chen, H., Li, C., Wang, J. and Cheng, S-Y. “Heavy Metal Adsorption and Release on Polystyrene Particles at Various Salinities.” Frontiers in Marine Science 8 (2021), doi:10.3389/fmars.2021.671802.

[133] Lionetto, F., Esposito Corcione, C., Messa, F., Perrone, S., Salomone, A. and Maffezzoli, A. “The Sorption of Amoxicillin on Engineered Polyethylene Terephthalate Microplastics.” Journal of Polymers and the Environment 31, no. 4 (2022): 1383–97. doi:10.1007/s10924-022-02690-0

[134] Capolupo. M., Girolamo Rombola, A., Sharmin, S., Valbonesi, P., Fabbri, D. and Fabbri, E. “Assessing the Impact of Chrysene-Sorbed Polystyrene Microplastics on Different Life Stages of the Mediterranean Mussel Mytilus Galloprovincialis.Applied Sciences 11, no. 19 (2021): 8924. doi:10.3390/app11198924.

[135] Trevisan, R., Uzochukwu, D. and Di Giulio, R.T. “Pah Sorption to Nanoplastics and the Trojan Horse Effect as Drivers of Mitochondrial Toxicity and PAH Localization in Zebrafish.” Frontiers in Environmental Science 8 (2020). doi:10.3389/fenvs.2020.00078

[136] Minchin, D., Cook, E. and Clark, P. “Alien Species in British Brackish and Marine Waters.” Aquatic Invasions 8, no. 1 (2013): 3–19. doi:10.3391/ai.2013.8.1.02

[137] Rech, S., Borrell Pichs, Y.J. and García-Vazquez, E. “Anthropogenic Marine Litter Composition in Coastal Areas May Be a Predictor of Potentially Invasive Rafting Fauna.” PLOS ONE 13, no. 1 (2018). doi:10.1371/journal.pone.0191859

[138] Carson, H.S., Nerheim, M.S., Carroll, K.A. and Eriksen, M. “The Plastic-Associated Microorganisms of the North Pacific Gyre.” Marine Pollution Bulletin 75, no. 1–2 (2013): 126–32. doi:10.1016/j.marpolbul.2013.07.054

[139] Cholewińska, P., Moniuszko, H., Wojnarowski, K., Pokorny, P., Szeligowska, N., Dobicki, W., Polechonski, R. and Gorniak, W. “The Occurrence of Microplastics and the Formation of Biofilms by Pathogenic and Opportunistic Bacteria as Threats in Aquaculture.” International Journal of Environmental Research and Public Health 19, no. 13 (2022): 8137. doi:10.3390/ijerph19138137

[140] Correia Prata, J., da Costa, J.P., Lopes, I., Duarte, A.C. and Rocha-Santos, T. “Environmental exposure to microplastics: An overview on possible human health effect.” Science of the Total Environment, 702, (2020): 134455. doi:10.1016/j.scitotenv.2019.134455

[141] Cho, Y., Shim, W.J., Jang, Mi., Han, G.M. and Hong, S.H. “Abundance and Characteristics of Microplastics in Market Bivalves from South Korea.” Environmental Pollution 245 (2019): 1114. doi:10.1016/j.envpol.2018.11.091

[142] Smith, M., Love, D.C., Rochman, C.M. and Neff, R.A. “Microplastics in Seafood and the Implications for Human Health.” Current Environmental Health Reports 5, no. 3 (2018): 375–86. doi:10.1007/s40572-018-0206-z

[143] Marfella, R., Prattichizzo, F., Sardu, C., Fulgenzi, G., Graciotti, L., Tatiana, S., D’Onofrio, N. and Paolisso, G. “Microplastics and Nanoplastics in Atheromas and Cardiovascular Events.” New England Journal of Medicine 390, no. 10 (2024): 900–910. doi:10.1056/nejmoa2309822

[144] European Commission. Environmental and Health Risks of Microplastic Pollution. Group of Chief Scientific Advisors. Scientific Opinion 6/2019. Pg. 8-14 ec_rtd_sam-mnp-opinion_042019.pdf (europa.eu)

[145] Rodrigues, A., Oliver, D.M., McCarron, A. and Quilliam, R.S. “Colonisation of Plastic Pellets (Nurdles) by E. Coli at Public Bathing Beaches.” Marine Pollution Bulletin 139 (February 2019): 376–80. doi:10.1016/j.marpolbul.2019.01.011.

[146] Keswani, A., Oliver, D.M., Gutierrez, T. and Quilliam, R.S. “Microbial Hitchhikers on Marine Plastic Debris: Human Exposure Risks at Bathing Waters and Beach Environments.” Marine Environmental Research 118 (2016): 10–19. doi:10.1016/j.marenvres.2016.04.006

  • 29 October 2024

4. Legislation governing land-derived litter

4.1

The composition of marine litter is highly influenced by the upstream sources that enter the marine environment directly, or via the pathways connecting land to sea. Given this, legislation controlling the potential land-based activities that generate marine litter in Scotland has been assessed (excluding public littering).

4.2

Figure 1 sets out the key legislation controlling land-based activities linked to land-derived sources of marine litter in Scotland. The legislative landscape is complex and fragmented. There are many regulations controlling individual activities that are not principally targeted at preventing the generation of marine litter. Rather their primary focus is on the prevention/minimisation of the environmental impact of the regulated activity.

4.3

For example, regulations controlling surface water run-off, sewage discharges (both treated and untreated), landfilling of waste and industrial activities aim to limit the release or effect(s) of contaminants that constitute litter, but currently have minimal regard for their impact on the marine environment. Secondly, given that marine litter can enter Scotland’s marine environment from a range of land-derived activities, it therefore spans across different regulatory sectors, such as waste, agriculture and wastewater. This adds to the complexity of the legislative landscape and contributes to a lack of transparency over how these regulations interact with each other and collectively tackle marine litter.


Relationship graph. Legislative and regulatory framework applicable to land-derived marine litter in Scotland.

Figure 1. Legislative and regulatory framework applicable to land-derived marine litter in Scotland.


4.4

Greater action is needed given the persistence of land-derived litter across Scotland’s marine environments and failure to meet GES for marine litter. ESS finds that there needs to be greater coherence and coordination across the current legislative and policy framework to control land-derived sources of marine litter. This would increase opportunities to prevent litter prior to it reaching the marine environment. For example, greater integration between the Scottish Government’s ‘Marine Litter Strategy’ and the ‘National Litter and Flytipping Strategy’ should lead to stronger measures to reduce land-derived litter at source.

4.5

NatureScot explored the interest in, and opportunities for, a ‘source-to-sea’ approach in relation to environmental action, policy and legislation in Scotland.[147] This work highlighted the role that more holistic management can play in delivering existing and emerging strategies and policies through creating greater collaboration and coordination across environmental systems and governance levels. The approach supports the resolution of issues/detrimental flows at the source to prevent negative effects elsewhere in the environmental system, which is highly relevant to addressing the issue of marine litter.

4.6

Recommendation 1: The Scottish Government should establish a ‘source-to-sea’ approach to enhance the effectiveness of current and future policy and legislation by improving coordination between terrestrial and marine litter strategies.

4.7

Figure 2 summarises the key sources of land-derived marine litter and the patchwork of legislation that controls these. It also presents an assessment of the degree to which the regulations governing each activity support the prevention of marine litter at source. Legislation classified as ‘strong’ is considered to directly effect on limiting marine litter at source; ‘moderate’ considers the legislation indirectly effects litter from those activities legislated for or gaps have been identified; ‘weak’ is where an absence of legislation concerning an activity has been identified, representing a key gap(s) in the current legislation.

4.8

Several potential gaps and inefficiencies of these regulations have been identified in respect of preventing marine litter at source, principally surface water run-off from roads, the discharge of treated sewage and plastic production and the plastic pellet supply chain – these are summarised below. As shown in section 2, evidence suggests that globally these are potentially the most significant sources of microplastics entering the marine environment from land-based activities.


Infographic. Summary of the key sources of land-derived litter into the marine environment, the current regulations governing them in Scotland and ESS’ assessment of their potential efficacy.

Figure 2. Summary of the key sources of land-derived litter into the marine environment, the current regulations governing them in Scotland and ESS’ assessment of their potential efficacy.


Surface water run-off from roads

4.9

Surface water run-off is a collective term used to describe any water from rainfall (or any meltwater from snow or ice) that flows over the surface of the ground and any matter (for example soil or road debris) that is picked up by that water as it flows.

4.10

The discharge of surface water run-off from roads is a controlled activity that is regulated and authorised by the Water Environment (Controlled Activities) (Scotland) Regulations 2011 (‘the CAR regime’).[148] There are three levels of authorisation required for controlled activities, intended to reflect relative environmental risk:

  • general binding rule (GBRs)
  • registrations
  • licences

4.11

Usually, the discharge of surface water run-off from roads to the water environment (via a surface water drainage system) is authorised under a GBR (GBR 10A and 10B), provided certain conditions are met. However, a licence is required for any motorways and trunk roads where one outfall serves a length of road greater than 1km in length.

4.12

Under the CAR regime it is a general requirement for the discharge of surface water run-off from all new developments (from 2007 onwards) to be treated by a Sustainable Urban Drainage System (SUDS). SUDS refers to a range of water management practices and facilities designed to drain and treat surface water in a way that more closely mimics natural drainage (rather than the more conventional practice of routing run off through a pipe to a watercourse). There are two exceptions to this requirement for new (post-2007) developments: (a) where the development is only a single dwelling and (b) where the discharge is directly to coastal waters. Developments constructed before 2007 are not required to be drained by SUDS, but there is a requirement to take reasonable steps to ensure that discharge does not result in pollution of the water environment.

4.13

SUDS have been shown to be an effective measure in reducing microplastic abundance in urban run-off outlets and therefore are an important regulatory measure.[149] A large proportion of roads in Scotland (those constructed before 2007 and those that discharge directly to coastal waters) are not required to be drained by SUDS and therefore, present a large source of rubber tyre wear that contributes to the prevalence of marine (predominantly plastic) litter.


Discharge of treated sewage

4.14

Sewage is treated at wastewater treatment plants before being discharged to the water environment. As discussed in section 2, although there is a high removal of microplastics during the treatment of sewage from the effluent (to the sludge), the sheer volumes of effluent discharged mean that it is still a significant source of microplastics. The discharge of treated sewage effluent is regulated under the CAR regime and the Urban Waste Water Treatment (Scotland) Regulations 1994.[150]

4.15

Monitoring of pollutants within wastewater effluent is a requirement of the authorisations (granted by the Scottish Environment Protection Agency (SEPA) under the CAR regime) controlling these discharges. Pollutants monitored include inorganic compounds (e.g. nitrate), metals (e.g. copper) and organic materials (e.g. phosphorus).[151] However, monitoring of microplastics in treated sewage effluent is not currently required and therefore the true effect of treated sewage discharges in contributing to marine microplastic pollution is unknown. A recent revision to the EU Urban Waste Water Directive introduces the requirement for monitoring of microplastics in treated sewage effluent and additional treatment requirements to remove microplastics (see section 10).

4.16

The European Federation of National Associations of Water Services (EurEau), of which Scottish Water is a member, has highlighted the importance of wastewater treatment as a pathway for microplastics to aquatic ecosystems. They also acknowledge that current technologies for wastewater treatment are not capable of removing all micropollutants, such as microplastics, and advocate for micropollutants to be controlled at source.[152] EurEau also supports the recent EU regulatory proposal on preventing unintentionally released microplastics (see section 10) as this will enable a regulatory framework implementing to control such micropollutants at source.[153]


Plastic Production and pre-production pellet supply chain

4.17

The production of organic chemicals (including plastic materials) is regulated by the Pollution Prevention and Control (Scotland) Regulations 2012 (‘the PPC Regulations’).[154] Currently, only large-scale industrial sites involved in the production of plastic materials fall under the scope of the PPC Regulations. Other (smaller scale) uses of plastics are currently not regulated by these environmental regulations but may fall under the scope of wider regulatory frameworks.

4.18

Currently, the pre-production pellet supply chain is unregulated. Operation Clean Sweep certification standard provides a set of voluntary guidelines for companies to reduce plastic pellet pollution into the environment and certifies compliance with standardised best practice, however a supply-chain approach was widely called for.[155]

4.19

Evidence shows that pre-production pellet pollution (comprising pellets, powders and flakes) into the aquatic environment can occur throughout the supply chain of plastic production, most notably when pellets are handled during transport (either via roads or shipping) and storage (see section 2). This represents a potential unaccounted source of marine litter. However, across the UK there is no evidence available to accurately quantify the current extent of pellet loss.

4.20

Scottish Government convened the ‘Scottish Plastic Pellet Loss Steering Group’, which, with others, sponsored the first plastic pellet publicly available specification standard ‘PAS 510:2021[156]. This standard sets out good practice guidelines for the handling and management of plastic pellets, flakes and powders across the supply chain. This standard is voluntary, and companies are not obliged to adhere to their requirements.

4.21

The steering group also proposed a set of principles that should be adopted to any supply chain approach to limit pre-production pellet loss, this includes an accredited external audit process (e.g. a pellet certification scheme) or integration into existing audit programmes to accompany the standard.[157] This work was used to inform the OSPAR recommendation 021/06 on the reduction of plastic pellet loss into the marine environment.[156] A similar proposal has also been made within the EU to introduce tighter regulation of the pre-production pellet supply chain but is anticipated that Small and Medium Enterprises (SMEs) or enterprises handling <1000 T per year will be exempt[158] (see section 10).

4.22

The draft SBSDP states that measures to improve plastic pellet handling and management across the plastics supply chain will be introduced by the end of 2025. OCS have committed to jointly developing a Europe Certification Scheme to minimise pellet loss across the supply chain,[159] this should be applied at an appropriate scale to ensure smaller operators are also included as per the OSPAR recommendation. Despite this, it is unknown when this will be implemented across Scotland.

4.23

Recommendation 2: ESS recommends that the Scottish Government must specify how they plan to implement improvements to the handling and management of plastic pellets and clarify if they are on target to implement this by the end of 2025.


ESS recognises the Scottish Government’s efforts to reduce plastic waste but more action is needed

4.24

The Scottish Government has developed focused legislation concerning single-use plastic items, including:

  • banning the use of plastic-stemmed cotton buds under the Environmental Protection (Cotton Buds) (Scotland) Regulations 2019[160]
  • prohibiting the manufacture and sale of rinse-off personal care products containing microplastics under The Environmental Protection (Microbeads) (Scotland) Regulations 2018[161]
  • banning the business use of certain single-use plastic products: cutlery, plates, straws, beverage stirrers and balloon sticks under The Environmental Protection (Single-use Plastic Products) (Scotland) Regulations 2021[162]

4.25

ESS also acknowledges the recent commitment from Scottish and UK Government to introduce new legislation to ban the manufacture, supply and sale of plastic-containing wet wipes in the UK.[163]

4.26

Progress on the introduction of a Deposit Return Scheme (DRS) for single-use plastic drinks containers has stalled. The DRS scheme was due to be introduced into Scotland in Summer 2023. However, it will now be introduced on a UK-wide basis no earlier than October 2027. Given the significant risks and impacts to the environment, ESS finds this delay regrettable and would stress the importance of ensuring timely and successful implementation of a DRS scheme.

4.27

Despite such efforts, single-use plastic items continue to dominate marine litter across Scotland. This indicates that current efforts to reduce marine litter are not adequate and delayed action by Scottish Government developing further targeted legislation is not an option. This includes the need for the Scottish Government to develop and implement policy regarding single-use plastic food containers following the recent call for evidence,[164] and should address appropriately all single-use items, such as packets and wrappers, considered under the EU Single-Use Plastics Directive.[165] Scottish Government should also ensure implementation of a DRS with no further delays.

4.28

At the European Union (EU)-level, the production of plastic waste is addressed through the Zero Pollution Action Plan that aims to reduce plastic pollution at sea by 30% by 2030. A part of this reduction is the adoption of a circular plastics economy through the ‘European Strategy for a Plastics in a Circular Economy’ and the EU ‘Circular Economy Action Plan’. ESS welcomes wider action towards the development of a circular economy in Scotland (including action to reduce plastic containing items) under the Circular Economy (Scotland) Act.[166] The wider ambition of the Scottish Government in its movement to a more circular economy should align with the EU and recognise the role in applying a circular economy to reducing plastic waste production that will support its aims in reducing litter in the marine environment.

4.29

Recommendation 3: ESS recommends that the Scottish Government, working with the UK Government where appropriate, should work with the UK Government to bring forward legislative proposals to reduce waste from single-use plastic food containers and plastic bottles and adopt a more circular economy approach to reduce plastic production.


[147] Kellock, C., Leakey, C., Schroder, C., Melville, N., Khan, J. and Mathieson, S. “Source to Sea – enabling coherent, efficient and synergistic outcomes.” NatureScot Research Report 1343. (2023) NatureScot Research Report 1343 – Source to Sea – enabling coherent, efficient and synergistic outcomes | NatureScot

[148] HM Government, (2011) The Water Environment (Controlled Activities) (Scotland) Regulations 2011 (legislation.gov.uk)

[149] Garcia-Haba, E., Hernandez-Crespo, C., Martin, M. and Andres-Domenech, I. “The role of different sustainable urban drainage systems in removing microplastics from urban runoff: A review.” Journal of Cleaner Production, 411, (2023): 137197. doi:10.1016/j.jclepro.2023.137197

[150] HM Government, (1994) “The Urban Waste Water Treatment (Scotland) Regulations 1994.” The Urban Waste Water Treatment (Scotland) Regulations 1994 (legislation.gov.uk)

[151] SEPA (2019). Measurement Assurance and Certification Scotland. MACS-WAT-01 Sampling and chemical testing of water (sepa.org.uk) Accessed 3 January 2024.

[152] EurEau. “Addressing micropollutants: a holistic approach” (2016) file (eureau.org)

[153] EurEau. “EurEau Position on the Regulation on Preventing Plastic Pellet Losses to Reduce Microplastic Pollution” (2024) file (eureau.org)

[154] HM Government, (2012) “The Pollution Prevention and Control (Scotland) Regulations 2012.” The Pollution Prevention and Control (Scotland) Regulations 2012 (legislation.gov.uk)

[155] OSPAR Guidelines in support of Recommendation 2021/06 on the reduction of plastic pellet loss into the marine environment. Pg. 8 *documents (ospar.org)

[156] PAS 510:2021 Plastic Pellets, flakes and powders – Handling and management throughout the supply chain to prevent their leakage to the environment. British Standards Institution. PAS 510:2021 – Tackling plastic pellet pollution head-on | BSI (bsigroup.com) Accessed 13 December 2023.

[157] Scottish Government (2020) “Preventing plastic pollution from pellet loss.” Preventing plastic pollution from pellet loss : Taking a supply chain approach to reduce pollution and waste (www.gov.scot)

[158] European Commission. (2023) “Proposal for a Regulation of the European Parliament and of the Council on preventing plastic pellet losses to reduce microplastic pollution.” COM(2023)645_0 (3).pdf

[159] OCS Europe. The OCS Europe Certification OCS-Certification (ocscertification.eu)

[160] HM Government, (2019) “The Environmental Protection (Cotton-Buds) (Scotland) Regulations 2019.” The Environmental Protection (Cotton Buds) (Scotland) Regulations 2019 (legislation.gov.uk)

[161] HM Government, (2018) “The Environmental Protection (Microbeads) (Scotland) Regulations 2018.” The Environmental Protection (Microbeads) (Scotland) Regulations 2018 (legislation.gov.uk)

[162] HM Government, (2021) “The Environmental Protection (Single-use Plastic Products) (Scotland) Regulations 2021.” The Environmental Protection (Single-use Plastic Products) (Scotland) Regulations 2021 (legislation.gov.uk)

[163] UK Government, (2024) UK-wide ban on wet wipes containing plastic to be put into law – GOV.UK (www.gov.uk)

[164] Scottish Government, (2024) Single-use food containers: call for evidence – summary – gov.scot (www.gov.scot)

[165] European Commission. Single-use plastics. Single-use plastics – European Commission (europa.eu) Accessed 16th February 2024.

[166] HM Government, (2024) “Circular Economy (Scotland) Act 2024” Circular Economy (Scotland) Act 2024 (legislation.gov.uk)

  • 29 October 2024

5. Legislation governing marine-derived litter

5.1

Overall, evidence suggests that marine-derived litter comprises a smaller proportion of marine litter globally than land-derived litter (see section 2). For Scotland, marine-derived litter, predominantly fishing gear, may present a greater pressure for more remote Scottish beaches surveyed across the Highlands and Islands, compared to Scottish beaches in the rest of Scotland.

5.2

Overarching regulation for waste generation and dumping of waste at sea by ships is through the ‘International Convention for the Prevention or Pollution from Ships’ (MARPOL)[167] and the ‘1996 Protocol to the Convention on the Prevention of Marine Pollution by Dumping of Wastes and Other Matter,1972’[168] (known as the “London Protocol”), respectively.

5.3

MARPOL governs the appropriate discharge of sewage (Annex IV) and garbage (covering fishing gear) (Annex V) from all vessels e.g. merchant ships, fishing, non-commercial pleasure crafts, including fixed or floating platforms into the marine environment.[169] In the UK, MARPOL Annex IV and Annex V are supported by The Merchant Shipping (Prevention of Pollution by Sewage from Ships) Regulations 2020 (‘the 2020 Regulations’).[170] The 2020 Regulations inhibit the discharge of ‘victual, domestic and operational wastes generated during the normal operation of a ship and liable to be disposed of continuously or periodically’. This includes the discharge of any plastic, including synthetic fishing nets, ropes and plastic bags.[171]


Relationship graph. Marine-derived litter sources.

Figure 3. Legislative and regulatory framework applicable to marine-derived marine litter in Scotland


5.4

In line with MARPOL is the EU Directive 2019/883 on port facilities for ship generated waste and cargo residues (the ‘PRF Directive’).[172] The PRF Directive requires EU ports to provide facilities for the deposition of ship-generated waste and cargo residues to reduce ship-sourced pollution. The PRF Directive also introduced charges to ships to cover the cost of waste treatment and disposal of ship-generated waste at ports. This Directive is implemented in the UK through the Merchant Shipping and Fishing Vessels (Port Waste Reception Facilities) Regulations 2003 (‘the 2003 Regulations’).[173]

5.5

Prior to an amendment in 2019, fishing vessels and recreational vessels (carrying fewer than 12 passengers), were exempt from paying the mandatory indirect fee under the PRF Directive. Despite this, they still had a legal obligation to land their waste at port facilities and cover the cost of delivery of ship-generated waste on a commercial basis.[174] At EU level it was reported that this could have been potentially incentivising waste to be discarded at sea by fishing vessels.[175]

5.6

In 2019, a review of the PRF Directive extended the ‘indirect fee’ to fishing vessels and recreational vessels (carrying fewer than 12 passengers). However, the 2019 update has not been implemented into the domestic 2003 regulations.[176] For Scotland, the Scottish Government’s ‘Marine Litter Strategy’ plans to extend access to the Port Waste Reception Facilities to fishing vessels with the aim that it will increase the responsible disposal of end-of-life gear without additional charges.[5] ESS would expect the Scottish Government to action this as part of its commitment to ‘keep pace’ with the EU on environmental standards and to deliver on its plans for improved waste management of end-of-life fishing gear by 2027.

5.7

Similarly, the PRF Directive (and 2003 Regulations) exempts fishing (and recreational vessels) reporting on the delivery of waste to ports, which may represent a regulatory gap for gear and waste discard.[19] A Eunomia report assessing the current international regulations reports that while the prohibition of discharging and dumping waste at sea are comprehensive, there is a lack of clarity surrounding fees (as discussed above), waste management, reporting obligations, inspection and enforcement.[19] For example, the exemption in the PRF Directive of fishing (and recreational vessels) to notify ports of waste disposal and the lack of requirements to report on or collect information on legal waste disposal by fishing vessels represents a potential regulatory gap in mitigating waste disposal at sea.[19] In conjunction with the lack of data surrounding fishing gear production and usage (see section 2), this lack of information and data collection further adds to the ambiguity of assessing the extent of fishing-derived litter.

5.8

Multiple factors affect the Scottish Government’s ability to reduce fishing-derived litter. These include a lack of understanding of the causes of fishing-derived marine litter in Scotland and a lack of regular data collection on the fishing gear in use by Scottish vessels and fishing waste generated in Scotland. Improvements are also needed to how end-of-life fishing gear is managed as a waste, considering the potential for reuse, recycling of elements and appropriate waste management and recycling facilities at port. This is partly acknowledged by the Scottish Government’s draft SBSDP to improve recycling routes for end-of-life fishing gear by 2027. At the EU-level, in 2021 the Single-Use Plastics Directive introduced a requirement for an extended producer responsibility scheme for fishing gear containing plastic to reduce its impact on the marine environment.[177] This has not yet been transposed into UK law.

5.9

Recommendation 4: ESS recommends that the Scottish Government should work with the UK Government to bring forward measures to tackle end-of-life fishing gear and should establish a programme of work to identify and address the drivers and causes of fishing-derived marine litter in Scotland.


[5] Li, W. C., TSE, H. F. and Fok, L. “Plastic waste in the marine environment: A review of sources, occurrence and effects.” Science of the Total Environment, 566, (2016): 333-349. doi:10.1016/j.scitotenv.2016.05.084

[19] Meijer, L.J.J., van Emmerik, T., van der Ent, R., Schmidt, C. and Lebreton, L. “More than 1000 rivers account for 80% of global riverine plastic emissions into the ocean.” Science Advances, 7, (2021): eaaz5803. doi:10.1126/sciadv.aaz58

[167] International Maritime Organization. “International Convention for the Prevention of Pollution from Ships (MARPOL).” International Convention for the Prevention of Pollution from Ships (MARPOL) (imo.org)

[168] 1996 Protocol to the Convention on the Prevention of Marine Pollution by Dumping of Wastes and Other Matter. Microsoft Word – PROTOCOLAmended2006 (imo.org)

[169] UNEP (2016). “Marine plastic debris and microplastics – Global lessons and research to inspire action and guide policy change.” UNEP, Nairobi. Marine Plastic Debris and Microplastics: Global Lessons and Research to Inspire Action and Guide Policy Change | UNEP – UN Environment Programme

[170] HM Government, (2020) “The Merchant Shipping (Prevention of Pollution by Sewage from Ships) Regulations 2020.” The Merchant Shipping (Prevention of Pollution by Sewage from Ships) Regulations 2020 (legislation.gov.uk)

[171] Maritime and Coastguard Agency (2009) “MGN 385 (M+F) Guidance on the merchant shipping (prevention of pollution by sewage and garbage from ships) regulations 2008.” Microsoft Word – 385 (publishing.service.gov.uk)

[172] European Commission (2019) “Directive (EU) 2019/883 of the European Parliament” Directive – 2019/883 – EN – EUR-Lex (europa.eu)

[173] HM Government, (2003) “The Merchant Shipping and Fishing Vessels (Port Waste Reception Facilities) Regulations 2003.” The Merchant Shipping and Fishing Vessels (Port Waste Reception Facilities) Regulations 2003 (legislation.gov.uk)

[174] Maritime and Coastguard Agency (2012) Guidance. “Prevent pollution and reduce harmful emission at sea.” Pg 5. Prevent pollution and reduce harmful emissions at sea – GOV.UK (www.gov.uk)

[175] European Parliament (2018). “Briefing. Initial Appraisal of a European Commission Impact Assessment. Port reception facilities for the delivery of waste from ships.” Strengthening aspects of the presumption of innocence and the right to be present at trial in criminal proceedings (europa.eu) Pg. 2

[176] UK Government, (2024) Guidance. “MGN 563 (M+F) Amendment 2 Guidance on the Merchant Shipping and Fishing Vessels (Port Waste Reception Facilities) Regulations 2003 and amendments” (www.gov.uk)

[177] European Commission, (2019) “Directive (EU) 2019/904 of the European Parliament”  Directive – 2019/904 – EN – SUP Directive – EUR-Lex (europa.eu)

  • 29 October 2024

6. Emerging threats from and sources of marine litter

6.1

As reported (section 2), there are several pathways in which litter is currently entering the marine environment across Scotland, and the wider UK. By statutory targets, we are currently failing to address and reduce well-evidenced sources and limit the impact of marine litter on Scottish marine environments.

6.2

This is a concern because as knowledge of physical marine litter increases, so does the list of potential emerging[viii] sources of litter pollution and the threats posed by it. While research labelled as understanding microplastic pollution dates back to 2004[178], we are only beginning to understand the potential harmful pollutants that can be released when plastics break down or what new substances can leach from their surfaces are only beginning to be understood

6.3

Several sources of physical marine pollution are becoming apparent in Scotland. Many of these sources are not new, but their contribution to levels of marine litter have only recently begun to be understood. Scotland’s Centre of Expertise for Waters published a report in 2015 on emerging contaminants in the aquatic environment detailing that agricultural run-off, soil erosion, waste disposal sites, aquaculture and offshore renewable developments[179] were possible sources of microplastics in Scotland. In addition, ESS has also identified artificial turf infill as a potential source of physical marine litter.[99],[180]


Microplastics in soil

6.4

OSPAR identified various sources of microplastics in soil that may impact the marine environment, these include paint emissions from shipyards, marinas, building and roads, sewage sludge, artificial pitches and road dust.[59] Depending on the source and surrounding topography, the report determined that, in Denmark and Norway, between 2 and 10% of microplastics directly enter surface water and between 5 and 90% directly entered soil.[59] A UK study found that soils in urban environments may contain microplastic concentrations of between 15.7 and 17.3 particles/g dry weight, whereas woodland soils surveyed contained no microplastics.[181] It is estimated that 60% of microplastics in soil reach rivers and the water environment.[182] However, no Scottish-based studies on the movement of physical pollutants from soil to the marine environment were identified. ESS has also identified other sources of microplastics in soil from agriculture, including plastic weed barriers, however there is limited evidence available of their impact on the marine environment.


Sewage sludge

6.5

Sewage sludge is a by-product of wastewater treatment. While microplastics are removed from effluent at WWTWs, they will remain in sludge that is applied to land.[66] However its contribution as a source relative to other microplastic pathways may be smaller than soil erosion and surface water road run off.[182],[183] Microplastic concentrations in UK sludge have been found to range from 25 to 10,380 particles/g dry weight (p/g-1).[66],[184],[185] Estimates suggest that 63,000 to 430,000 T of microplastics (equivalent to 7.2 to 129 trillion particles) are applied to European agricultural soils through the application of sewage sludge each year.[186],[187] Microplastics transport modelling suggests that microplastic loads increase in the River Thames following application of sludge to nearby land but very little is understood regarding the quantities which may reach the aquatic environment from this source.[48],[188]


Coastal landfill and beach dune erosion

6.6

Historically in the UK many landfills were built in the coastal zone on low value land that is susceptible to coastal erosion. This could lead to the potential release of landfilled waste into the marine environment.[189] In England there are ~1,200 historic landfills built without any engineered waste management in tidal flood zones.[190],[191]

6.7

In England and Wales, 28% of the coastline is eroding by at least 10cm per year. Models estimate that roughly 10% (122) of historic coastal landfills will erode into coastal waters by 2055 in England and Wales.[192] For Wales, these results were supported in another study that found six out of 78 historic coastal landfills at high risk of eroding in the next 20 to 100 years.[190] One European study found that coastal landfills breached by erosion may present a more significant source of microplastics than WWTWs[192] – making this a potential emerging source of marine litter.

6.8

For Scotland, coastal landfills at risk of eroding into the sea have been identified, including at the Eden Estuary in Fife;[193] however, no studies have reported the impact of coastal landfills on marine litter levels. Despite this, erosion and leaching of marine litter at specific coastal landfill sites has been highlighted in the media. The scale and extent of coastal landfill erosion is currently unknown but is at risk of becoming more prominent.

6.9

Beach litter can build up in dunes as they develop and therefore can act as a secondary source of litter into the marine environment via dune erosion in a similar way to coastal landfill erosion.[194] One study in England identified litter up to 57 years old being released from eroded dunes. Macroplastics of this age were found to have degraded in the dune system and so were becoming a source of microplastics.[195] The storage of plastic litter in dunes may account for discrepancies between plastic production and disposal estimates and the mass of plastics in the ocean.[196] No studies have been identified which quantify the introduction of litter from eroding dunes to the marine environment.


Artificial turf infill

6.10

Rubber granules are commonly used as infill on artificial turf sports pitches to keep the synthetic grass fibres upright. These are lost to the surrounding environment and must be replenished regularly. OSPAR has identified these granules in synthetic turf sports pitches as a potential source of microplastics via their movement from soils, sewers and into receiving surface waters.[59] It is estimated that 50% of infill can be lost to the environment.[197],[198] Around 5 to 10% of the synthetic grass fibres are also lost to the environment due to wear and tear.[59]

6.11

Very little evidence is available to assess the extent to which artificial turf acts as a marine litter source in Scotland and many wider studies only present estimates of microplastic loss that have not been verified empirically. A study of microplastics in the Scottish environment estimated that between 443 and 1,772 T of microplastics are lost from artificial football turf in Scotland per year and a further 11 to 102 T from equestrian surface but the amount ending up in the water or marine environments was not calculated.[99]

6.12

Domestic use of artificial turf is unlikely to contain plastic infill; however, the grass ‘pile’ fibres may wear or break to release microplastics. The impacts of this are expected to be small compared to artificial pitches;[99] however, its use in domestic gardens has increased with the Society of Garden Designers claiming that one in ten gardens now have artificial lawns.[199]


[viii] Sources are classed as emerging where there is limited published information and understanding of them is poor.


[48] Murphy, F., Ewins, C., Carbonnier, F. and Quinn, B. “Wastewater Treatment Works (WwTW) as a source of Microplastics in the Aquatic Environment.” Environmental Science and Technology, 50, (2016): 5800-5808. doi:10.1021/acs.est.5b05416

[59] Kole, P.J., Lohr, A.J., Van Belleghem, F.G.A.J. and Ragas, A.M.J. “Wear and Tear of Tyres: A Stealthy Source of Microplastics in the Environment.” International Journal of Environmental Research and Public Health, 14, (2017): 1265. doi:10.3390/ijerph14101265. Pg. 13. Table 13.

[66] Mason, S. A., Garneau, D., Sutton, R., Chu, Y., Ehmann, K., Barnes, J., Fink, P., Papazissimos, D. and Rogers, D. L. “Microplastic pollution is widely detected in US municipal wastewater treatment plant effluent.” Environmental Pollution, 218, (2016): 1045-1054. doi:10.1016/j.envpol.2016.08.056

[99] OSPAR Commission. Action 56: Abandoned, Lost, Discarded Fishing Gear – snagging sites and historic dumping grounds. Action 56: Abandoned, lost, discarded fishing gear – Snagging sites and historic dumping grounds | OSPAR Commission

[178] Imogen Ellen Napper and Richard C. Thompson, “Plastic Debris in the Marine Environment: History and Future Challenges.” Global Challenges 4, no. 6 (2020). doi:10.1002/gch2.201900081.

[179] Hartl, M.G.J., Gubbins, E., Gutierrez, T. and Fernandes, T.F. “Review of Existing Knowledge – Emerging Contaminants: Focus on Nanomaterials and Microplastics.” CREW  (2015): 4. CREW_Emerging_Contaminants.pdf (hw.ac.uk)

[180] PITCHIN. “Microplastic loss from artificial (3G) pitches in context of the ECHA proposed restriction of microplastics intentionally added to products”. Briefing by Fidra. Fidra-Microplastic-loss-from-artificial-3G-pitches_v4-.pdf

[181] Billings, A., Carter, H., Cross, R.K., Jones, K.C., Pereira, M.G. and Spurgeon, D.J. “Co-Occurrence of Macroplastics, Microplastics, and Legacy and Emerging Plasticisers in UK Soils.” Science of The Total Environment 880 (2023): 163258. doi:10.1016/j.scitotenv.2023.163258

[182] Nizzetto, L., Bussi, G., Futter, M.N., Butterfield, D. and Whitehead, OP.G. “A Theoretical Assessment of Microplastic Transport in River Catchments and Their Retention by Soils and River Sediments.” Environmental Science: Processes &amp; Impacts 18, no. 8 (2016): 1050–59, doi:10.1039/c6em00206d

[183] Corradini, F., Meza, P., Eguiluz, R., Casado, F., Huerta-Lwanga, E. and Geissen, V. “Evidence of Microplastic Accumulation in Agricultural Soils from Sewage Sludge Disposal.” Science of The Total Environment 671 (2019): 416. doi:10.1016/j.scitotenv.2019.03.368

[184] Ball, H.; Cross, R.; Grove, E.; Horton, A.; Johnson, A.; Jürgens, M.; Read, D.; Svendsen, C. “Sink to River—River to Tap. A Review of Potential Risks from Nanoparticles and Microplastics”; UKWIR: London, UK, 2020. Sink to River – River to Tap – A review of potential risks from nano-particles & microplastics (ukwir.org)

[185] Harley-Nyang, D., Memon, F.A., Jones, N. and Galloway, T. “Investigation and Analysis of Microplastics in Sewage Sludge and Biosolids: A Case Study from One Wastewater Treatment Works in the UK.” Science of The Total Environment 823 (June 2022): 153735. doi:10.1016/j.scitotenv.2022.153735

[186] Luca Nizzetto, Martyn Futter, and Sindre Langaas, “Are Agricultural Soils Dumps for Microplastics of Urban Origin?” Environmental Science Technology 50, no. 20 (2016): 10777–79. doi:10.1021/acs.est.6b04140.

[187] Easton, T, “The application of sewage sludge to agricultural land in Scotland: risks and regulations.” Scottish Environment Link; Perth, (2023). The-application-of-sewage-sludge-to-agricultural-land-in-Scotland.pdf (scotlink.org)

[188] Beni, N.N., Karimifard, S., Gilley, J., Messer, T., Schmidt, A. and Bartelt-Hunt, S. “Higher Concentrations of Microplastics in Runoff from Biosolid-Amended Croplands than Manure-Amended Croplands.” Communications Earth & Environment 4, no. 1 (2023): 42. doi:10.1038/s43247-023-00691-y

[189] Irfan, M., Houdayer, B., Shah, H., Kooj, A. and Thomas, H. “GIS-Based Investigation of Historic Landfill Sites in the Coastal Zones of Wales (UK).” Euro-Mediterranean Journal for Environmental Integration 4, no. 1 (2019): 1-10. doi:10.1007/s41207-019-0116-y

[190] O’Shea, F.T., Cundy, A.B. and Spencer, K.L. “The Contaminant Legacy from Historic Coastal Landfills and Their Potential as Sources of Diffuse Pollution.” Marine Pollution Bulletin 128 (2018): 446–455. doi:10.1016/j.marpolbul.2017.12.047

[191] Brand, J.H., Spencer, K.L., O’shea, F.T. and Lindsay, J.E. “Potential Pollution Risks of Historic Landfills on Low‐lying Coasts and Estuaries.” WIREs Water 5, no. 1 (2017): e1264. doi:10.1002/wat2.1264

[192] Kazour, M., Terki, S., Rabhi, K., Jemaa, S., Khalaf, G. and Amara, R. “Sources of Microplastics Pollution in the Marine Environment: Importance of Wastewater Treatment Plant and Coastal Landfill.” Marine Pollution Bulletin 146 (2019): 608–18. doi:10.1016/j.marpolbul.2019.06.066

[193] Rennie, A.F., Hansom, J.D., Hurst, M.D., Muir, F.M.E., Naylor, L.A., Dunkley, R.A. and MacDonell, C.J. “Dynamic Coast: Adaptation and Resilience Options for St Andrews Link” Centre of Expertise for Waters (CREW), 2021. (gla.ac.uk)

[194] Andriolo, U. and Gonçalves, G. “Is Coastal Erosion a Source of Marine Litter Pollution? Evidence of Coastal Dunes Being a Reservoir of Plastics.” Marine Pollution Bulletin 174 (2022): 113307. doi:10.1016/j.marpolbul.2021.113307

[195] Turner, A., Amos, S.L. and Williams, T. “Coastal Dunes as a Sink and Secondary Source of Marine Plastics: A Study at Perran Beach, Southwest England.” Marine Pollution Bulletin 173 (2021): 113133. doi:10.1016/j.marpolbul.2021.113133

[196] Lebreton, L., Egger, M. Slat, B. “A Global Mass Budget for Positively Buoyant Macroplastic Debris in the Ocean.” Scientific Reports 9, no. 1 (2019): 12922.  doi:10.1038/s41598-019-49413-5

[197] Lassen, C., Hansen, S.F., Magnusson, K., Hartmann, N.B., Jensen, P.R., Nielsen, T.G. and Brinch, A. “Microplastics: Occurrence, Effects and Sources of Releases to the Environment in Denmark.” Danish Environmental Protection Agency (DTU), 2015: 118-119. Microplastics: Occurrence, effects and sources of releases to the environment in Denmark — Welcome to DTU Research Database

[198] A Weijer, J Knol, and U Hofstra, “Verspreiding van Infill En Indicatieve Massabalans. Rapport i.o.v. BSCN i.s.m. Gemeenten Rotterdam, Utrecht, Amsterdam En Den Haag.” SWECO, 2017.

[199] Society of Garden Designers. “Say No to Plastic Grass & Plants.” Society of Garden Designers, accessed February 20, 2024. Say No to Plastic Grass & Plants | Society of Garden Designers (sgd.org.uk)

  • 29 October 2024

7. Scotland has an obligation to reduce marine litter

7.1

Scottish Ministers’ statutory duty to reduce marine litter across the marine environment is underpinned by domestic legislation. A statutory requirement of the ‘Marine (Scotland) Act 2010’ (‘the 2010 Act’)[200] led to the development of Scotland’s National Marine Plan (NPA), which states that measures must be taken to address and reduce marine litter throughout the development of marine spatial plans in Scotland.[201] The 2010 Act, together with the ‘Marine and Coastal Access Act 2009’,[202] provides powers to Scottish Ministers to introduce measures to promote the sustainable management of Scotland’s inshore (0 to 12 nautical miles) and offshore (12 to 200 nautical miles) waters.

7.2

While this enables marine litter to be tackled as a devolved matter, efforts to mitigate marine litter also occur at a UK level under the Marine Strategy Regulations 2010 (‘the 2010 Regulations’). The 2010 Regulations transposes the EU Marine Strategy Framework Directive (MSFD) into UK law and provide the framework for the achievement of GES for 11 qualitative descriptors by 2020 and led to the development of the UKMS.

7.3

The UKMS covers the extent of the marine waters over which the UK exercises jurisdiction and extends from the landward boundary of coastal waters (equivalent to Mean High Water Springs) to the outer limit of the UK Exclusive Economic Zone.[203],[ix] This comprises the Celtic Seas and Greater North Sea MFSD subregions (see Figure 5) of which Scotland has an obligation to contribute to the achievement of GES at a UK-level.


Map showing postcodes of Scottish Marine Regions and Offshore Marine Regions

Figure 4. Scottish Marine Regions and Offshore Marine Regions


Source: Scottish Assessment areas (Scottish Government, 2019)

Key:  S1, Forth and Tay; S2, North East; S3, Moray Firth; S4 Orkney Islands, S5, Shetland Isles; S6, North Coast; S7, West Highlands; S8, Outer Hebrides; S9, Argyll; S10, Clyde; S11, Solway; O1, Long Forties, O2, Fladen and Moray Firth Offshore; O3, East Shetland Shelf; O4, North and West Shetland Shelf; O5, Faroe-Shetland Channel; O6, North Scotland Shelf; O7, Hebrides Shelf; O8, Bailey; O9, Rockall; O10, Hatton.


7.4

GES is the state at which marine waters are ecologically diverse, dynamic and are clean, healthy and productive. Achieving GES will ensure that marine ecosystems are able to respond to anthropogenic pressure and provide long-term sustainability of its goods and resources.[204] Descriptor 10 directly concerns the achievement of GES for marine litter across the UK and sets the high-level objective that “The amount of litter and its degradation products on coastlines and in the marine environment is reducing and levels do not pose a significant risk to the environment and marine life”.

7.5

More widely, the UK is a Contracting Party to several international agreements that pledge to prevent litter reaching the marine and coastal environment. Most notably, the UK is a Contracting Party to OSPAR – the regulatory instrument that coordinates regional co-operation across the North-East Atlantic for its protection. OSPAR requires the prevention and elimination of pollution from land-based and offshore sources.[205] The UK is situated within OSPAR Maritime Area Region II (Greater North Sea) and Region III (Celtic Seas) (see Figure 5).

7.6

Wider coordination and collaboration occur through the ‘Convention on Biological Diversity’ and its key Sustainable Development Goal 14 concerning ‘Life Below Water’ that underpins the conservation, and sustainable use of, marine and coastal biodiversity.[206]


Map showing comparison of Marine Strategy Framework Directive subregion and OSPAR region spatial extents for “Celtic Seas” and “Greater North Sea”Sources: OSPAR Regions and Subregions (OSPAR, 2017), National Marine Plan Interactive (2024)

Figure 5. Comparison of Marine Strategy Framework Directive subregion and OSPAR region spatial extents for “Celtic Seas” and “Greater North Sea”Sources: OSPAR Regions and Subregions (OSPAR, 2017), National Marine Plan Interactive (2024)


7.7

The Scottish Government published a ‘Marine Litter Strategy’ for Scotland in 2014 to coordinate action on marine litter and provide measures to prevent litter entering the marine and coastal environments. The aims of the strategy to reduce marine litter underpin the legislative framework set out in the 2010 Act in promoting sustainable use of the marine environment. The Marine Directorate of the Scottish Government are responsible for the implementation of the strategy and ensuring progress against its aims.

7.8

Recognising the difficulties in tackling marine litter, an updated ‘Marine Litter Strategy’ was devised in 2022 with key strategic directions to continue coordination with the ‘National Litter and Flytipping Strategy’, improve monitoring at a Scottish level and develop ways to evaluate the strategy. Specifically, it details planned actions on SRD, plastic pellets and fishing and aquaculture.[207]

7.9

The Scottish Government’s draft SBSDP also outlines key actions to tackle marine litter. This includes ambition to deliver a microplastics monitoring programme, to improve recycling routes for end-of-life fishing gear and enable improvements to plastic pellet handling and management across the plastics supply chain.[208]

Table 1. Summary of targets, long term objectives and current monitoring programmes for marine litter under the UK Marine Strategy and OSPAR.


Marine Litter
 

High level objective for GES: The amount of litter and its degradation products on coastlines and in the marine environment is reducing and levels do not pose a significant risk to the environment and marine life.

OSPAR objective: Prevent inputs of and significantly reduce marine litter, including microplastics, in the marine environment to reach levels that do not cause adverse impacts to the marine and coastal environment with the ultimate aim of eliminating inputs of litter.


Assessment criterion Common indicator Assessment targets (GES and OSPAR) OSPAR threshold value
Presence of litter (beaches) Beach Litter common indicator (OSPAR) A decrease in the total amount of the most common categories of litter found on surveyed beaches. An OSPAR threshold value was agreed in 2023 of 20 litter items per 100 meters of coastline [209]
Presence of litter (seabed) Seafloor Litter/International Benthic Trawl (IBTS) common OSPAR indicator A decrease in the number of items of litter on the seabed None
Presence of floating litter Plastic particles in fulmar stomachs (common OSPAR indicator for North Sea) A downward trend in the number of northern fulmars with more than 0.1 g of plastic particles in their stomach <10% of northern fulmars having more than 0.1g plastic particles in the stomach over a period of at least 5 years in samples of at least 100 birds.[210]
Presence of microlitter Under development – methodology needs to be developed and agreed in OSPAR Develop an appropriate indicator to measure microlitter in the marine environment None


[ix] An exclusive economic zone is the zone in which the coastal state exercises the rights under Part V of the United Nations Convention on the Law of the Sea. These rights relate principally to the water column and may extend to 200 nautical miles from baselines.


[200] HM Government, (2010) “Marine (Scotland) Act 2010” Marine (Scotland) Act 2010 (legislation.gov.uk)

[201] Scottish Government. “Scotland’s National Marine Plan. A single Framework for Managing Our Seas.” March 2015. Scotland’s National Marine Plan: A Single Framework for Managing Our Seas (www.gov.scot)

[202] HM Government, (2009) “Marine and Coastal Access Act 2009”. Marine and Coastal Access Act 2009 (legislation.gov.uk)

[203] Defra. “Marine Strategy Part One: UK updated assessment and Good Environmental Status.” October 2019. Marine Strategy Part One: UK updated assessment and Good Environmental Status (publishing.service.gov.uk) pg 18-19.

[204] Defra. “Marine Strategy Part One: UK updated assessment and Good Environmental Status.” October 2019. Marine Strategy Part One: UK updated assessment and Good Environmental Status (publishing.service.gov.uk) pg 12-13.

[205] OSPAR Convention (1992) Convention for the Protection of the Marine Environment of the North-East Atlantic. Sintra Statement Paper (ospar.org)

[206] Convention on Biological Diversity. Biodiversity and the 2030 Agenda for Sustainable Development Policy Brief. biodiversity-2030-agenda-policy-brief-en.pdf (cbd.int)

[207] Scottish Government, (2022). “A Marine Litter Strategy for Scotland” September 2022. Marine litter strategy – gov.scot (www.gov.scot)

[208] Scottish Government, (2023) “Tackling the nature emergency. Consultation on Scotland’s Strategic Framework for Biodiversity.” September 2023. Tackling the Nature Emergency – Consultation (www.gov.scot)

[209] OSPAR Commission. Beach litter | OSPAR Commission Accessed 14 March 2024.

[210] OSPAR Commission. Plastic particles in fulmars | OSPAR Commission

  • 29 October 2024

8. The UK is failing to achieve statutory targets for marine litter

8.1

Despite Scotland’s, and the wider UK’s, statutory obligation to reduce marine litter, the most recent assessment of GES (published in 2019) indicated that the UK was not on track to achieve GES by 2020, based on its targets for each marine litter indicator (see Table 2). The assessment considered data for the period 2008 to 2015 collected for three indicators covering the abundance of litter items recorded on beaches, floating at sea and distributed on the seabed, as detailed in Table 2. The next assessment is due in 2024.

8.2

More recent data across the same indicators, included in assessments by OSPAR and by Defra, also suggests that GES for marine litter has still not been met. A summary of trends from each assessment is below and summarised in Table 5.


2019 GES assessment

Beach litter indicator

8.3

The assessment determined that the UK target for beach litter had not been met. For beach litter, the average total abundance was 296 items/100m for the Celtic Seas and 196 items/100m for the Greater North Sea over the period 2008 to 2015. In the Greater North Sea there was a significant increase in litter over this period while in the Celtic Seas, levels in 2015 were similar to 2008 despite a temporary decrease between 2011 and 2013 (Table 3). The most commonly detected items were plastic fragments (including polystyrene), food and drinks packaging, SRD and smaller fishing-related litter. Plastic bottles showed no significant[x] trends in abundance. Cotton buds, an indicator for SRD, did decrease in the Celtic Seas from 2012; however, they increased in the Greater North Sea in the same period.[38]


Floating litter indicator

8.4

For floating litter, 94% of the 88 birds analysed had ingested plastic and 63% of fulmars had ingested more than 0.1 g of plastic between 2010 and 2014. Importantly, there was no significant decrease in this indicator values from the previous periods of the monitoring programme period 2005 to 2009.[211]


Seafloor litter indicator

8.5

For seafloor litter, a greater abundance of litter and plastic/km2 were reported across the Greater North Sea than the Celtic Seas from 2012-2015; however, a trend was not reported as a five-year period is required for this analysis. Within the Greater North Sea, a higher abundance of seafloor litter was found in the southern North Sea, that this could be linked to greater human pressures within the southern areas compared to northern North Sea areas.[212]


OSPAR assessment

8.6

Marine litter indicators used in the most recent assessment of GES (published in 2019) are translated from common OSPAR indicators and assessed through the same OSPAR Monitoring Programmes, as depicted in Table 2. However, it should be noted that the first GES assessment for beach litter included wider beach clean data gathered during MCS’ Great British Beach Clean initiative. The ‘OSPAR Quality Status Report 2023’ provides a more recent assessment of marine litter for OSPAR beaches and therefore provides insight into the current trajectory towards achieving GES for each marine litter indicator. The relevant assessments for the Greater North Sea (OSPAR Region II) and the Celtic Seas (OSPAR Region III), in which the UK are situated, have been examined; however these regions cover a greater spatial extent over which the UKMS has jurisdiction.


Beach litter indicator

8.7

For beach litter abundance, there has been a statistically significant decrease in the median total count of all litter items recorded in the Greater North Sea and the Celtic Seas from 2015 to 2020. This was also reported for median plastic counts. Despite this, the median total count of 278 items/100m in the Celtic Seas and 205 items/100m in the Greater North Sea for the period 2018 to 2020 still exceed the OSPAR threshold value for beach litter (Table 2; Figure 6).[210] The OSPAR threshold value (20 litter items per 100 meters of coastline) is the value considered to reduce harm from beach litter to a sufficiently precautionary level.[213] It should be noted that OSPAR assesses beach litter abundance across a three-year period, whereas the 2019 GES methodology analysed litter abundance on a single-year basis.

8.8

As part of the latest OSPAR assessment, only three beaches in Scotland were included in the assessment: Cramond beach and Kinghorn Harbour (representing the Greater North Sea) and Lunderston Bay within the Celtic Seas region. Survey data indicated that Cramond recorded a median of 1,194 items/100m, a significant decrease over the period 2015 to 2020. However, Lunderston Bay and Kinghorn Harbour showed no significant downward trend from 2015 to 2020 with medians of 2,807 items/100m and 215 items/100m, respectively (Table 2).[214]


Floating litter indicator

8.9

For floating litter, there was evidence of a significant decline in ingested plastics across 2009 to 2018 for the Greater North Sea region overall – this is driven by a reduction in user plastics recorded. However, the majority (4 out of 5) of the decreasing trend assessments for regions assessed within the Greater North Sea were statistically non-significant. Despite this, among 393 fulmar stomachs analysed in the period 2014 to 2018, 51% contained more than 0.1 g of plastic – exceeding the agreed OSPAR threshold value of 10% (see Table 2).[215] The OSPAR threshold value reflects the abundance of floating litter and provides an indication of harm.[216] Further analysis of the two classifications of plastic (user and industrial) recorded in fulmar stomachs shows that most plastic is predominantly consumer-based (i.e. user plastics).


Seafloor litter indicator

8.10

Seafloor litter is widespread across the OSPAR area. For the Greater North Sea, the probability of litter being collected from the seafloor has increased, from 57% in 2012 to 75% in 2019. For seas surrounding the UK, there was a greater probability of detecting litter in a trawl from the Greater North Sea region (75%) than in the Celtic Seas (43%). Both the OSPAR and GES assessments identified plastic as the predominant litter type surveyed on the seafloor.[217]

Table 3. Median count of beach litter items per 100m of beach on Scottish beaches over time. Source: OSPAR beach_litter_appendix_1.pdf (ospar.org). Defra report, 2022, Table A8. UK Marine Strategy / OSPAR Beach Litter Monitoring Data Collection – ME5438 (defra.gov.uk)

Area Median count of litter items/100m Period Source
Cramond 1194 2018-20 OSPAR
Lunderston Bay 2807 2018-20 OSPAR
Kinghorn Harbour 215 2018-20 OSPAR
Cramond 1279 2020-22 Defra
Lunderston Bay 558.5 2020-22 Defra
Kinghorn Harbour N/A – Lack of data 2020-22 Defra


Defra assessment

Beach litter indicator

8.11

Defra funds MCS to produce an annual report on beach litter in the UK in line with the OSPAR methodology. The most recent report, published in April 2023, found that a median of 374 litter items per 100m were found between 2020 and 2022 across the UK. Sites in Scotland had the highest median (919/100m) followed by England (585 /100m), Northern Ireland (258/100m) and Wales (103 items/100m) (Table 4). However, it should be noted that only two Scottish beaches were included in this assessment while the median count for devolved countries Northern Ireland, England and Wales have 12, four, and three survey sites, respectively.

8.12

Across the UK, there has been a significant decrease in the median count of beach litter between 2017 and 2022, with a decrease of 6.7 items/100m per year. This was particularly noted for single use plastics. The most substantial decrease was between 2018 and 2020 with no improvement since. The report indicates that Scotland is also on a downward trend with a significant decrease of 42.7 items/100m per year between 2017 and 2022. Of the Scottish beaches, Lunderston Bay has a significant decreasing trend over 2017 to 2022 while trends for the other two beaches were not significant.[218] In contrast to previous assessments, the Greater North Sea UK Region had a higher median count at 996 items per 100m than the Celtic Seas UK Region at 170.5/100m. Both had statistically significant overall downward trends from 2015 (Table 4).

Table 4. Median count of beach litter items per 100m of beach, 2020 to 2022. Source: Defra report, 2022. UK Marine Strategy / OSPAR Beach Litter Monitoring Data Collection – ME5438 (defra.gov.uk)


Country Median count of litter items/100m
Scotland 919
England 585
Northern Ireland 258
Wales 103


Floating litter indicator

8.13

Defra also funds an annual/interim project report on UKMS Indicator 10 (marine litter).[219] Over the period 2017 to 2021 on the Greater North Sea coast of the UK, 84% of 108 investigated fulmars had some plastic in their stomachs. 45.3% had more than 0.1 g of plastic in the stomach, well above the <10% OSPAR threshold value. Over the period 2012 to 2021 (161 sampled fulmars), for all plastics combined and the sub-category, user plastic decreased significantly while industrial plastics showed a non-significant downward trend. Within the UK areas included in the analysis (UK Greater North Sea coast area only), all plastics decreased on the UK mainland region and in Shetland but not on the Orkneys where there is a non-significant decrease. However, it should be noted that the Shetland and Orkney areas each had less than 50 birds in the assessment in the 2017 to 2021 period.[220]

8.14

Based on GES, OSPAR and Defra assessment data for 2004 to 2021, simple linear regression analysis suggests that it would take until 2044 to drop below the 10% of fulmars having less than 0.1g of plastic threshold value. Restricting the GES, OSPAR and Defra assessment data between 2012 to 2021 and representing a more ‘optimistic scenario’ that takes account of recent declining trends, analysis suggests it would still take until 2033 to drop below the OSPAR threshold value. However, this analysis is based on 14 and 6 data points, respectively, and should be interpreted with caution.

Table 5. A summary of the trends in marine litter indicators.


*Trends assessed over different time periods. For beach litter, this considers 2008 to 2015 while for floating litter it considers 2005 to 2014.

**Trends assessed over different time periods. For beach litter, this considers 2015 to 2020, for floating litter it considers 2009 to 2018 and for seabed litter it considers 2012 to 2019.

***Published by OSPAR for beach litter and calculated by ESS for floating litter. In relation to floating litter, OSPAR notes that a statistically significant decrease is seen in the full North Sea region as a result of combining samples from all of the different sub-samples. However, no statistically significant changes are seen in individual sub-regions except for the South Eastern North Sea where the sample sizes are much greater.

****Trends assessed over 2017 to 2022 for beach litter and 2017 to 2021 for floating litter.

Note a trend is only identified as increasing or decreasing if this is statistically significant.


Bar graph showing Median total abundance of litter items/100m by area, according to the most recent OSPAR assessment (2018-2020)

Figure 6. Median total abundance of litter items/100m by area, according to the most recent OSPAR assessment (2018-2020)


Line graph showing percentage of fulmars with more than 0.1g of plastic in their stomachs

Figure 7. Percentage of fulmars with more than 0.1g of plastic in their stomachs


8.15

More recent analysis commissioned by Defra suggests that there may now be a downward trend for indicators on the presence of beach litter and the presence of floating litter in more recent years. Despite this, both indicators are far exceeding the OSPAR threshold values (Figure 6 and Figure 7), while the recent OSPAR assessment for seafloor litter indicator suggests an upward trend for litter abundance. Given this, for marine litter overall, while some improvements have been made, litter item abundance is still far exceeding the threshold values[220] set by OSPAR to reduce harm from beach and floating litter.[214]


[x] In this report, ESS use the term significant exclusively when referring to statistical significance as depicted by appropriate statistical testing. This means that any observed data or trend is statistically not occurring by chance.


[38] Storrier, K.L., McGlashan, D.J., Bonellie, S., Velander, K. “Beach Litter Deposition at a Selection of Beaches in the Firth of Forth, Scotland.” Journal of Coastal Research, 23, (2007): pp. 813-822. doi:10.2112/04-0251.1.

[211] Dorrington, T. and van Franeker J.A. “Plastic Particles in the Fulmar Stomachs in the North Sea.” (2018) UK Marine online assessment tool. moat.cefas.co.uk

[212] Maes, T. and Barry, J. “Composition and Spatial Distribution of Litter on the Seafloor.” UK Marine online assessment tool. moat.cefas.co.uk

[213] OSPAR Commission. Monitoring & assessing marine litter | OSPAR Commission. Accessed 14 March 2024

[214] OSPAR Commission. OSPAR Quality Status Report 2023. Annex 1. beach_litter_appendix_1.pdf (ospar.org)

[215] OSPAR Quality Status Report 2023. Plastic Particles in Fulmar Stomachs in the North Sea. Plastic Particles in Fulmar Stomachs in the North Sea (ospar.org)

[216] Plastic particles in fulmars | OSPAR Commission

[217] OSPAR Quality Status Report 2023. Composition and Spatial Distribution of Litter on the Seafloor (ospar.org)

[218] UK Marine Strategy / OSPAR Beach Litter Monitoring Data Collection – ME5438 (defra.gov.uk)

[219] Defra, (2021). Using Norther Fulmars as an Ecological Monitor of Marine Litter in Line with Indicators set for MSFD descriptor 10 – 2017-2020 – ME5227 (defra.gov.uk)

[220] Monitoring & assessing marine litter | OSPAR Commission

  • 29 October 2024

9. Current GES indicators and monitoring are insufficient

9.1

From the evidence considered by ESS, several limitations have been identified regarding the current monitoring programmes associated with the three marine litter indicators assessed for GES under the UKMS. These concern methodological improvements needed to better understand trends in marine litter, particularly at a Scotland-level, and to improve understanding on the key sources of marine litter.

9.2

Overall, indicators for marine litter under the UKMS provide an assessment of where litter is deposited/likely to ‘end’ up in the marine environment – they do not enable efficient monitoring of the key sources and pathways of marine litter, such as the input of litter to the marine environment via rivers.

9.3

In addition, the current indicators quantify litter at a single point in time, or at multiple timepoints throughout the year for repeat studies. As identified in the literature, much less is known regarding the flux of litter within a region, such as how much is being deposited, or redeposited, onto the foreshore. It is unknown how much litter is being taken out of a region or territorial boundary, and equally how much a territorial boundary acts as a ‘sink’ for litter dispersing from other countries waters.[23]


Beach litter indicator

9.4

The UKMS is set up to provide a UK-wide assessment of the health of its marine waters, while the OSPAR convention provides a regional assessment of the marine environment across the North-East Atlantic. For the assessment of beach litter within Scotland, ESS finds that the current UKMS monitoring programme survey sites for marine litter indicators are failing to provide a more detailed assessment of marine litter across Scottish waters.

9.5

In the most recent GES assessment (and upcoming assessment in 2024), beach litter data from only three Scottish beaches have been analysed – this is the same spatial resolution assessed at an OSPAR level. The three Scottish beaches currently surveyed (Cramond, Kinghorn Harbour and Lunderston Bay) are localised around the Firth of Forth and Firth of Clyde. As a result, beach litter from other parts of the Scottish coastline, such as the Highlands and Islands regions, Aberdeenshire, Moray and the Scottish Borders are not assessed and reported on under the UKMS.

9.6

ESS finds that the current spatial resolution of beach litter data at a Scotland-level is insufficient to provide a robust and representative assessment of Scottish beach litter into the UKMS, or a more detailed assessment than what the ‘OSPAR Quality Status Report 2023’ provides.


Seafloor litter indicator

9.7

The current assessment of GES was unable to report a trend on the abundance of seafloor litter due to insufficient data time series. While a trend is expected to be reported on in the next GES assessment (due in 2024), ESS finds that several methodological limitations associated with this indicator may mean that it is not able to establish trends in seafloor litter that are sufficiently representative of the Celtic Seas and Greater North Sea.

9.8

Currently, data for this indicator is only collected via fisheries survey trawls where the primary aim of the sampling survey is to aid fish stock assessments. As a result, assessment of this indicator is conducted via opportunistic sampling rather than a well-designed survey methodology for seabed litter. ESS acknowledges that this may be partly due to the financial costs of performing seabed surveys. Given this, data collected for this indicator may only be representative of areas where a trawler can access, such as soft substrate areas. Secondly, surveys will only be conducted at the time of year optimal for assessing fish abundance, limiting the ability to assess and report on changes in the abundance of seafloor litter throughout the year, and if so, what factors may be affecting this.

9.9

It was recognised in the last GES report that greater spatial coverage was required for the Southern Celtic Seas, and greater understanding of how gear type, weather patterns and currents may impact the distribution of seafloor litter.[213] Collectively, there is potentially insufficient spatial and temporal resolution obtained in this indicator data to be able to make a robust assessment of seabed litter across the UK.

9.10

The ‘UK Marine Strategy Part Two: UK updated monitoring programmes’ report recognised this spatial limitation there is commitment to improve the assessment methodology through the OSPAR Seafloor Litter Expert Working Group.[221] For example, on communication with Joint Nature Conservation Committee (JNCC), a joint pilot project they are conducting with Cefas investigating the use of autonomous underwater vehicle (AUV) images to count seafloor litter abundance has shown that this methodology allows greater detection of litter items per km2 than trawl surveys. Scottish Government should ensure it adopts such emerging technologies to better monitor and identify hotspots of marine litter at a Scottish level.


Microplastic indicator

9.11

The next assessment of GES (due in 2024) will not include the anticipated indicator for assessing microplastic in marine sediment, despite being an operational target in the ‘UK Marine Strategy Part 2’ report.[222] Defra have noted that this indicator has been approved at OSPAR and may feed into the OSPAR intermediate assessment in 2028 but has not been formally accepted for us at a UK level. ESS understands that the work of Marine Directorate is expected to contribute to the development of this indicator at an OSPAR-level.

9.12

In addition, there is no known statutory or non-statutory monitoring of all microplastics in the marine environment in Scotland. Given the evidence surrounding the high abundance of microplastics in the marine environment, a potentially large proportion of marine litter is not being assessed in Scotland. Microplastic monitoring should be developed in alignment with standardised microplastic methodology, such as the recent Standard Operating Procedures[13] developed for monitoring microplastics in surface waters and sediment of rivers for guidelines on sampling microplastics.[223] This will ensure that comparative analysis and assessment of trends for microplastic data can be performed at a Scottish and UK-wide level.


Citizen science underpins statutory and non-statutory monitoring of marine litter in Scotland

9.13

Citizen science performs a fundamental role in understanding marine litter. Data collected through citizen science initiatives provides a significant contribution to understanding the extent and potential sources of beach litter across Scotland’s marine environment alongside the work of NGOs in raising public awareness of marine litter.

9.14

MCS’s citizen science Beachwatch programme has provided the most comprehensive assessment of the potential sources and extent of marine litter across Scotland’s foreshores, with surveys dating back to 1993. MCS and its volunteers also perform beach surveys across select OSPAR reference beaches using a standardised methodology agreed by OSPAR. This data forms part of Scotland’s (and the wider UK’s) input to the common indicator for beach litter under the UKMS assessment and OSPAR ‘Abundance, Composition and Trends of Beach Litter’ assessment for the Greater North Sea and Celtic Seas regions.

9.15

Data collected under MCS’s Beachwatch programme was also used to develop the Scottish Beach Litter Performance Indicators (SBLPI) by Marine Scotland to ‘monitor the state of litter on its Scottish beaches, as well as assess the success of its policies in reducing sources of marine plastics and litter’.[224] These pilot indicators (e.g. ‘Plastic – Fishing Related’ and ‘All Sanitary’) were formed based on the availability of MCS data, relevance to industry and Scottish Government policy.[18] The SBPLIs were then used to assess the state of litter on beaches across SMRs and OMRs for the SMA2020 to inform the development of Scotland’s NPA.

9.16

Alongside MCS beach surveys, Fidra conduct a global citizen science programme, The Great Nurdle Hunt, that collects data on plastic pellet pollution and provides the greatest insight into pellet pollution at a UK level.[225] Similarly, Keep Scotland Beautiful’s ‘Upstream Battle’ citizen science project aims to prevent marine litter at its source by collecting data on riverine litter to better understand what and where land-derived litter is getting into Scottish rivers.[226]

9.17

It is evident that statutory monitoring obligations under the UKMS do not provide a comprehensive assessment of marine litter at a Scottish scale and such data gaps are currently being partially filled by NGOs. Given this, statutory monitoring to better understand the current extent and the most prevalent and emerging sources of marine litter at a Scotland-level must be strengthened. This monitoring should be underpinned by a statutory framework to ensure that monitoring of marine litter is effective and resilient, whether delegated to public authorities or NGOs where appropriate.

9.18

Recommendation 5: ESS recommends that the Scottish Government should work through OSPAR and with the UK Government to agree a programme to implement suitable indicators and an effective and resilient monitoring programme to assess marine litter. This includes:

  • representative sampling of Scottish beaches/waters sufficient to effectively monitor the sources, pathways and fluxes of marine litter
  • implementation of the OSPAR ‘microplastic in marine sediment indicator’ across Scotland and the UK, and the development of an appropriate assessment of microplastics on beaches

[13] Eunomia. (2016) “Plastics in the Marine Environment”. Plastics in the Marine Environment – Eunomia Research and Consulting pg. 8

[18] Eunomia (2016) “Study to support the development of measures to combat a range of marine litter sources.” Study to Support the Development of Measures to Combat a Range of Marine Litter Sources – Eunomia Research and Consulting

[23] Lacroix, C., André, S., and van Loon, W. (2022). Abundance, Composition and Trends of Beach Litter. In: OSPAR, 2023: “The 2023 Quality Status Report for the North-East Atlantic.” OSPAR Commission, London. Abundance, Composition and Trends of Beach Litter (ospar.org)

[213] OSPAR Commission. Monitoring & assessing marine litter | OSPAR Commission. Accessed 14 March 2024

[221] Defra, (2022). “Marine Strategy Part Two: UK updated monitoring programmes.” October 2022. Pg. 74 updated UK Marine Strategy Part Two (publishing.service.gov.uk)

[222] Defra, (2022). “Marine Strategy Part Two: UK updated monitoring programmes.” October 2022. Pg. 73  updated UK Marine Strategy Part Two (publishing.service.gov.uk)

[223] Defra, (2023) “Measurement and Characterisation of Microplastics in English River Catchment Waters and Sediments.” Measurement and Characterisation of Microplastics in English River Catchment Waters and Sediments – WT15135 (defra.gov.uk)

[224] Turrell, W. R “Pilot Scottish Beach Litter Performance Indicators (SBLPI).” Scottish Marine and Freshwater Science, 10, no. 4 (2019). Scottish Marine and Freshwater Science Vol 10 No 4.pdf

[225] Fidra. “The Great Nurdle Hunt.” Nurdles – Fidra Accessed 12 January 2024.

[226] Keep Scotland Beautiful. Upstream Battle® (keepscotlandbeautiful.org) Accessed 12 January 2024.

  • 29 October 2024

10. Maintaining alignment with EU and international standards

10.1

The EU have recently initiated several measures (across a range of policy areas) with the potential to reduce the generation of marine litter. The Scottish Government has committed to ‘keep pace’ with the EU on environmental standards and, as such, will need to monitor and consider whether to bring forward proposals to mirror the following EU developments in Scottish Law.


Intentionally added microplastics

10.2

The EU has recently adopted measures (under Regulation 2023/2055)[227] to restrict the intentional inclusion of microplastics (covering all synthetic polymer particles below 5 mm that are organic, insoluble and resist degradation) into products. This new regulation revises the EU Regulation 1907/2006 on the Registration, Evaluation, Authorisation and Restriction of Chemicals (‘the REACH Regulations’).[228] Restricted products will include granular infill used in artificial sports surfaces, cosmetics, detergents and fertilisers.

10.3

In Scotland, currently only personal care products containing microplastics are prohibited (under The Environmental Protection (Microbeads) (Scotland) Regulations 2018).[162] Given the expansion of recent EU proposals to prohibit the intentional addition of microplastics to a much wider range of products and the prevalence of microplastics in Scotland’s marine environment, the Scottish Government should seek to bring forward legislative proposals (where feasible to do so within the confines of their legislative capacity) to ‘keep pace’.


Urban wastewater

10.4

The EU has recently adopted a revision to the Urban Waste Water Treatment Directive.[229] The revision introduces several new requirements that have the potential to reduce the generation of marine litter and increase understanding on the potential impact of urban run-off, including:

  1. A requirement to produce ‘integrated urban wastewater management plans’ to tackle pollution from urban run-off and storm water overflows;
  2. Tightening the required level of treatment at sewage treatment works including the introduction of quaternary treatment to remove micropollutants (including microplastics) for larger works or smaller works discharging to areas where the accumulation of micropollutants poses a risk to the environment or human health. The implementation of this requirement is staggered, with 100% of all plants within scope delivering quaternary treatment[xi],[230] by the end of 2045;
  3. Introduction of an extended producer responsibility scheme that requires producers (or importers) of products with micro-pollutants to contribute to the costs of the required quaternary treatment; and
  4. A requirement to monitor micropollutants from urban run-off, storm water overflows and outlets of sewage treatment works. Additionally, microplastics are to be monitored at both the inlet and outlets of WWTWs.

10.5

In Scotland, the Urban Waste Water Directive was transposed into Scottish law via the Urban Waste Water Treatment (Scotland) Regulations 1994. Given the introduction of recent EU proposals and the significant role urban wastewater plays in contributing to marine litter in Scotland, the Scottish Government should bring forward legislative proposals (where feasible to do so within the confines of its legislative capacity) to ‘keep pace’.


Plastic pellets

10.6

The EU have proposed a new Regulation to introduce measures to directly tackle pollution from the unintentional release of plastic pellets. An impact assessment into the EU Commission’s proposal for preventing pellet loss stated that regulatory failure is the most significant driver of pellet loss as no EU regulatory framework directly addresses pellet loss.[230] The proposed Regulation sets requirements on best handling practices, mandatory certification and self-declaration, and the development of methodology to estimate pellet loss. These are proposed to apply to companies making and handling greater than 5 tonnes of pellets per year, as well as EU and non-EU carriers transporting pellets in the EU.[231]

10.7

Given the current lack of statutory regulation of the plastic pellet supply chain in Scotland and the potentially significant unaccounted source of marine litter, the Scottish Government should monitor the development of the proposed EU Regulation and seek to bring forward legislative proposals (where feasible to do so within the confines of its legislative capacity).

10.8

This aligns with the commitment of the Scottish Government, set out in the Scottish Biodiversity Strategy draft delivery plan[209] to reduce marine litter and marine plastics through enabling improved plastic pellet handling and management across the whole plastics supply chain to reduce pellet loss and provide guidance to support pellet clean up in the environment by the end of 2025.


Tyre wear

10.9

The recently adopted EU Regulation 2024/1257[232] concerning emissions from motor vehicles aims to measure and limit non-exhaust emissions (evaporative, tyre abrasion and brake emissions) from vehicle tyres and brakes. Particles released from tyre wear is estimated to be the largest source of microplastics into the environment (see section 2) and is expected to comprise up to 90% of all particles emitted from road transport by 2050.[232] The Regulation sets out requirements for manufacturers to measure tyre abrasion and for the EU Commission to define abrasion limits for tyres.

10.10

The Scottish Government will need to bring forward legislative proposals if Scotland is to maintain alignment with wider advancements in a number of areas of environmental standards and protection within the EU that have the potential to reduce the prevalence of land-derived inputs to marine litter.

10.11

Recommendation 6: The Scottish Government should set out how it proposes to maintain alignment with regulatory developments in the EU that are aimed at reducing microplastics in the marine environment. Relevant developments include:

  • recently adopted measures to restrict the intentional inclusion of microplastics (covering all synthetic polymer particles below 5 mm that are organic, insoluble and resist degradation) into products under the REACH Regulations
  • a recast Urban Waste Water Directive that will introduce requirements to monitor microplastics in wastewater inlets/outlets and undertake treatment of wastewater to remove microplastics
  • a proposal to introduce the first regulatory measures to directly tackle pollution from the unintentional release of plastic pellets across the pellet supply chain
  • a recently adopted regulation that sets requirements for manufacturers to measure tyre abrasion and for the EU Commission to define abrasion limits for tyres


[xi] Primary treatment of urban wastewater comprises a physical and/or chemical process involving settlement of suspended solids. Secondary treatment comprises a process generally involving biological treatment with a secondary settlement or another process which reduces biodegradable organic matter. Tertiary treatment comprises a process which reduced nitrogen and/or phosphorus from urban wastewater. Quaternary treatment comprises a process which reduces a broad spectrum of micropollutants from urban wastewaters.


[162] HM Government, (2021) “The Environmental Protection (Single-use Plastic Products) (Scotland) Regulations 2021.” The Environmental Protection (Single-use Plastic Products) (Scotland) Regulations 2021 (legislation.gov.uk)

[227] European Commission, (2023). “Commission Regulation (EU) 2023/2055“ Regulation – 2023/2055 – EN – EUR-Lex (europa.eu)

[228] European Commission, (2006). “Regulation (EC) No 1907/2006 of the European Parliament“ EUR-Lex – 02006R1907-20221217 – EN – EUR-Lex (europa.eu)

[229] Council of the European Union. 2022/0345(COD), “Proposal for a Directive of the European Parliament and of the Council concerning urban wastewater treatment (recast).” pdf (europa.eu)

[230] European Commission, (2023). Impact Assessment Report. “Combatting microplastic pollution in the European Union.” Section 2.4.2 EUR-Lex – 52023SC0332 – EN – EUR-Lex (europa.eu)

[231] European Commission, (2023). “Proposal for a Regulation of the European Parliament and of the Council on preventing plastic pellet losses to reduce microplastic pollution.” EUR-Lex – 52023PC0645 – EN – EUR-Lex (europa.eu)

[232] European Union, (2024). “Regulation (EU) 2024/1257 of the European Parliament” Regulation – 2024/1257 – EN – EUR-Lex (europa.eu)

Back to top